July 2021
Organizations invest heavily to improve customer experience and drive engagement. But with so much focus on customers, they often deprioritize the employee experience and the technology that employees use. This is a mistake. Practically every technology that employees interact with can impact employee experience, and having a good experience delivers better business outcomes, such as higher employee engagement, enhanced customer experience, fewer security vulnerabilities, and reduced costs1.
In 2019, Apple commissioned Forrester Consulting to conduct a Total Economic Impact™ (TEI) study and examine the potential return on investment (ROI) enterprises may realize by deploying Mac devices to their employees. In 2021, Apple commissioned Forrester Consulting to update the 2019 study to include the impact that the new M1 processers have on enterprise Mac deployments. The purpose of this study is to provide readers with a framework to evaluate the potential financial impact of deploying Mac — including Macs with the Apple M1 chip — on their organizations.
Apple introduced its M1 chip in 2020, and it improved the performance, power efficiency, and battery life of Apple devices that use it. Macs with M1 chips are compatible with iOS and iPadOS applications, which enables organizations to run iPhone and iPad applications natively on their laptops or desktops for the first time. In addition to the M1 chip, Apple also released new versions of it’s Mac operating system (macOS) that build on and expand the security and collaboration capabilities highlighted in the original study.
To better understand the benefits, costs, and risks associated with this investment, Forrester interviewed decision-makers from 10 organizations with experience deploying both M1-based and non-M1-based Mac computers. For the purposes of this study, Forrester aggregated the experiences of the interviewees’ organizations and combined the results into a single composite organization.
Prior to using Macs, the organizations were largely PC-based. However, interviewees said their focus on enterprise PC deployments introduced common challenges. Managing and deploying PCs (especially remotely) was manual and time-consuming for IT FTEs, and employees wanted to use Macs and were using their own personal Mac devices in unsupported states. Decision-makers looked for ways to improve employee engagement and retention and to attract new talent. They also hoped to improve the security reliability and performance of their organization's hardware.
For organizations that already had Mac deployments, device costs were the biggest factor that limited more widespread adoption. But as Apple improved the performance and power efficiency with M1, customers were able to deploy more Macs while staying in the same price range of a baseline PC that most workers used.
Interviewees said their organizations chose to implement employee choice programs and deploy enterprise Mac because: 1) decision-makers believe Macs are easier to deploy and to manage; 2) they wanted to improve the employee experience (EX) at their organizations; and 3) they believe Mac is a more secure platform than PC.
By introducing the more powerful M1 Macs (specifically the MacBook Air and 13-inch MacBook Pro) into their employee choice programs, the organizations had a new baseline device that could serve a larger percentage of their employees at a lower starting point than previous Macs and/or PC devices. Additionally, according to early tests that the interviewees’ organizations conducted, M1 Macs outperform all of their PC devices and even some of their previous-generation Macs regardless of price point.
In addition to the benefits outlined in the 2019 study, organizations using M1 Macs were able to further reduce IT management costs, accelerate the adoption/deployment of Mac devices, and improve employee productivity for all employees who leverage Mac.
Quantified benefits.The following benefits reflect the three-year financial analysis associated with the composite organization. Although the M1 Macs are relatively new, Forrester leveraged data and the financial model framework from the 2019 study along with new data collected through additional interviews to forecast the following results:
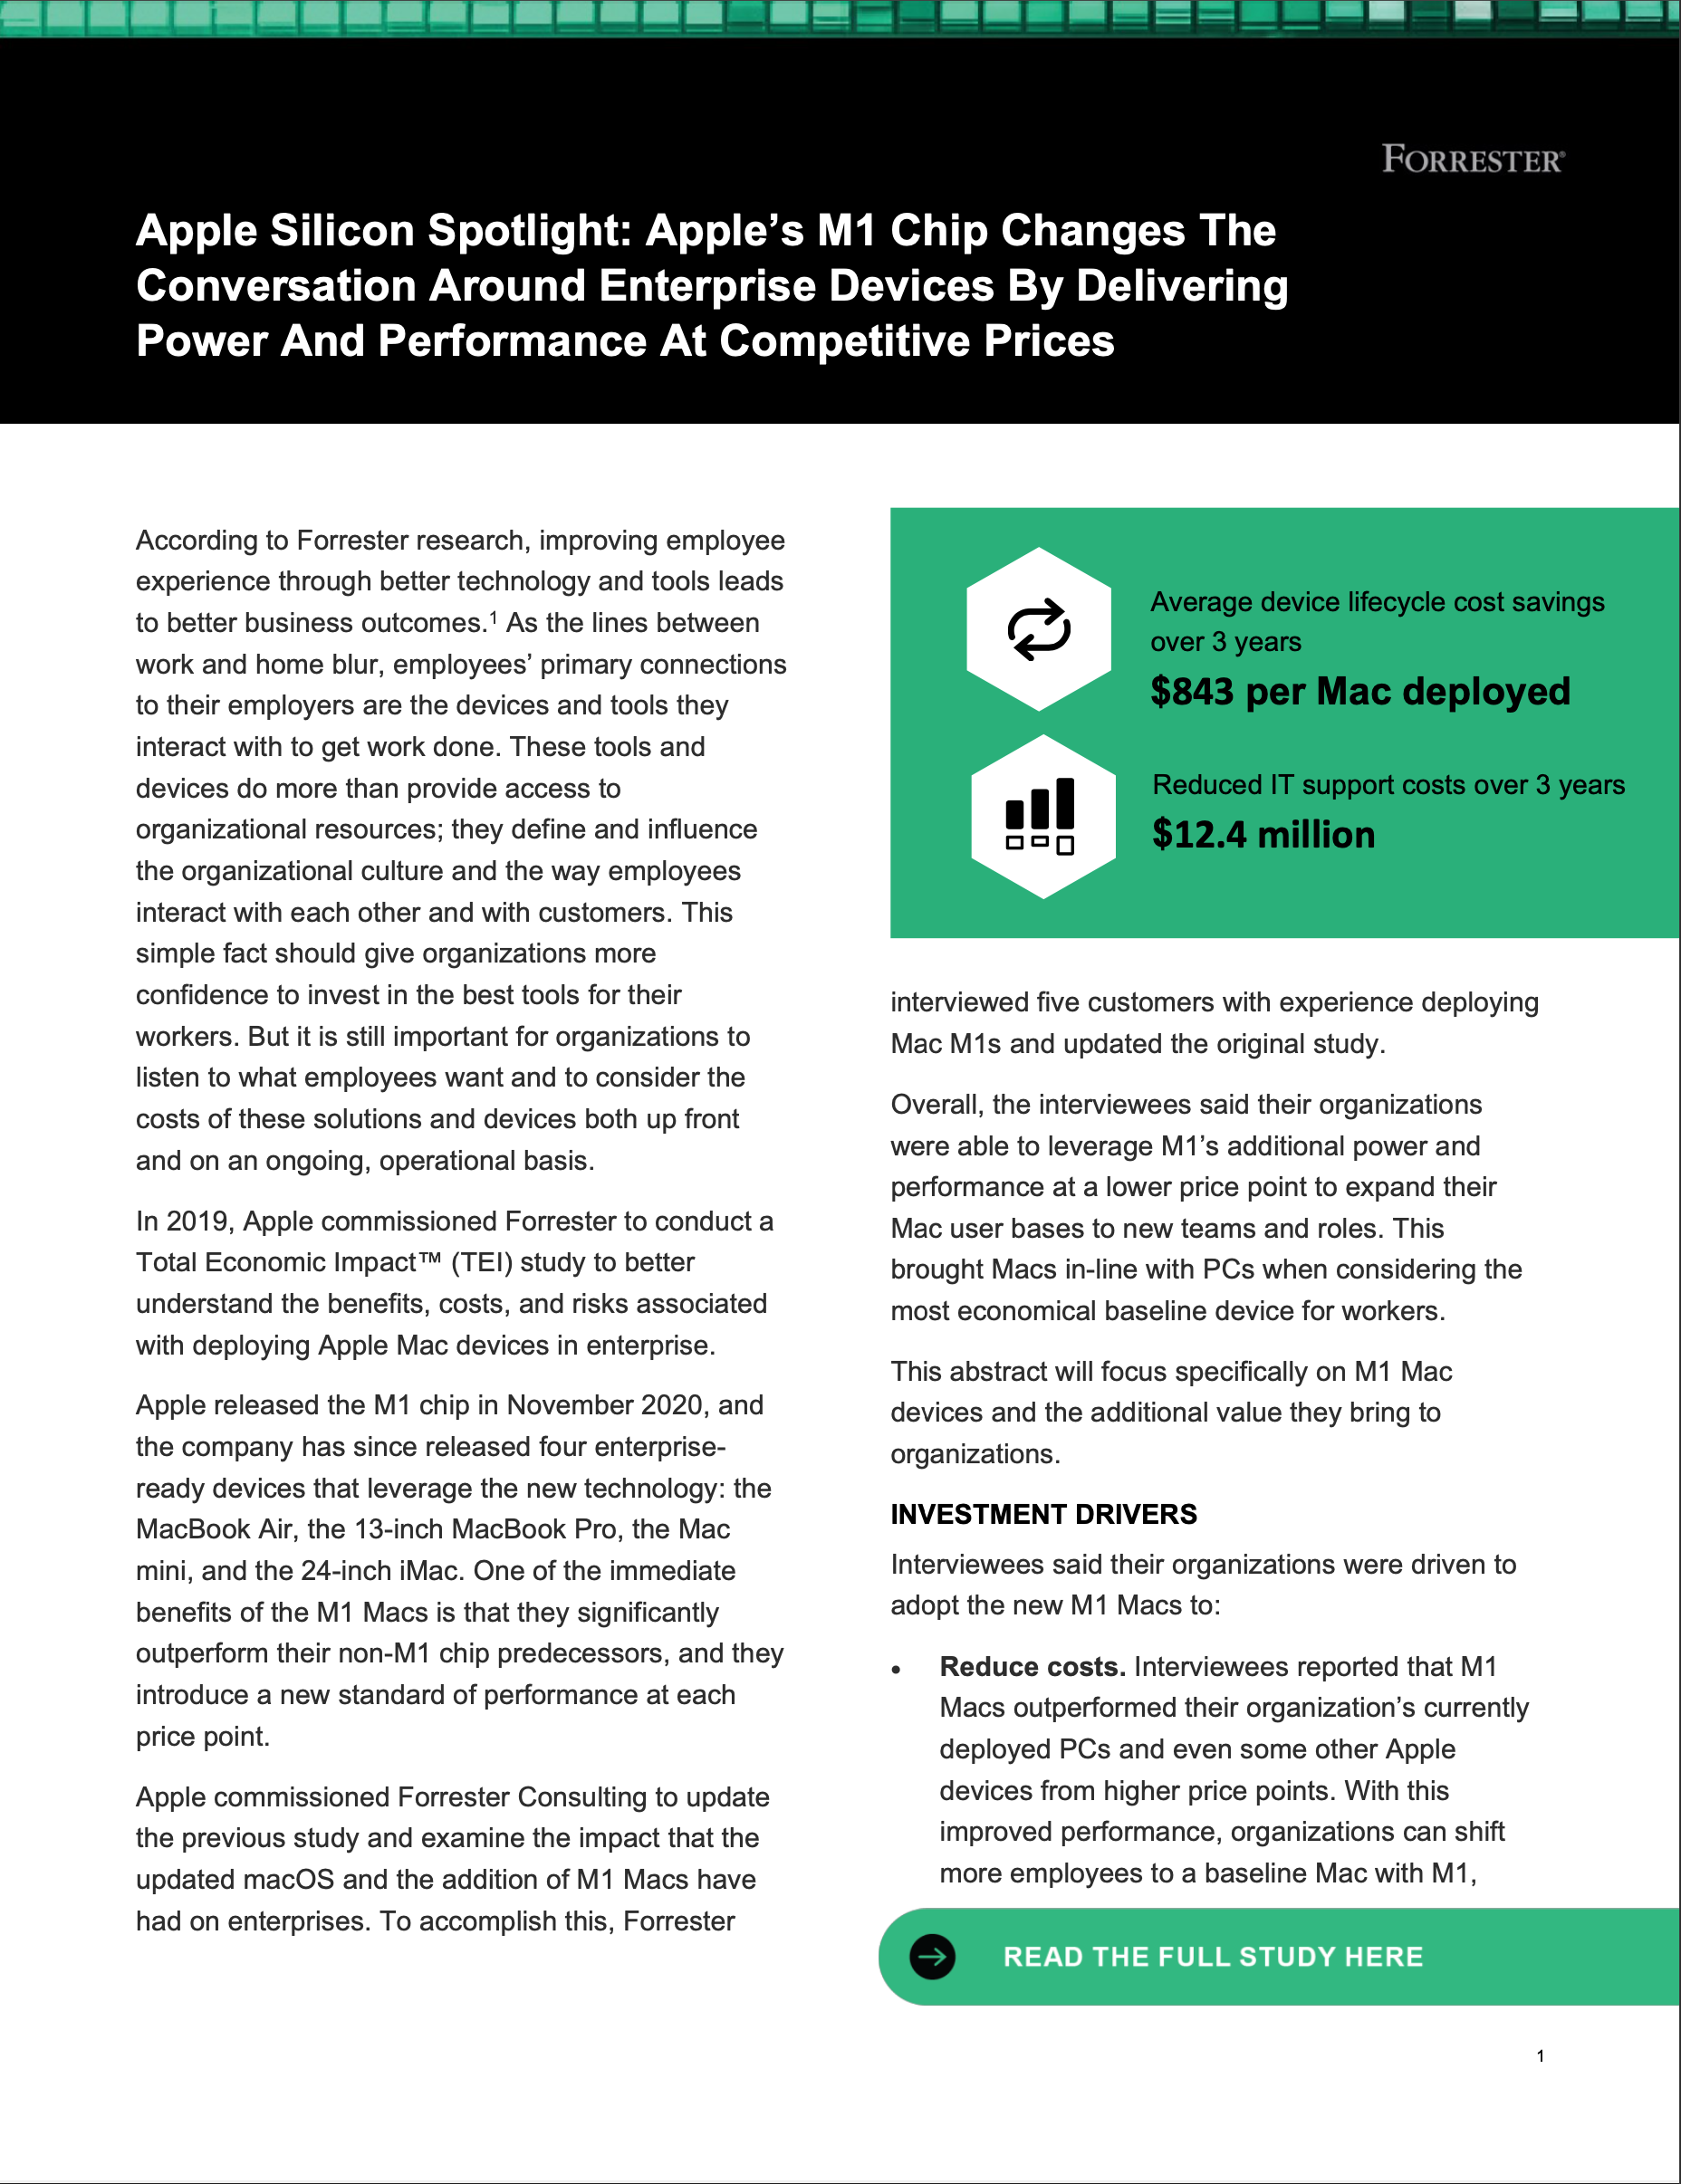
During the three-year device lifecycle, organizations save $635 per Mac when comparing the cost of support and operation of PCs. Interviewees reported that the zero-touch deployment process and mobile device management (MDM) enrollment is just as simple on M1 Macs as it is on their legacy Macs, and it is still considerably simpler than deploying PCs. Additionally, consistent with the 2019 study, organizations can manage more Mac devices per IT FTE, and the organizations receive fewer service tickets from Mac users.
During the three-year device lifecycle, Mac costs $207.75 less than comparable PCs when comparing hardware and software costs. Because of M1’s improved power, organizations can deploy baseline devices to more of their employees. This reduces the average device cost while giving more employees more computing power than they had before.
Additionally, there is no need to purchase an operating system license or a software maintenance contract for Mac, and the underlying architecture and included security features obviate the need for some additional endpoint security licenses.
The energy consumption of M1 Macs is even lower than that of previous Macs, which means that deploying Mac leads to more energy savings than those detailed in the original study. With M1, organizations are able to reduce the average Mac device cost by $300 in Year 3 and by $200 when looking at all devices purchased during the three-year period.
Interviewees said they are excited to explore the full security implications of M1, and they consider their organizations’ M1 Macs to be just as secure (if not more secure) than their legacy Macs, and significantly more secure than their PC counterparts. They said built-in security features like automatic data encryption, anti-malware capabilities, and the ease of enrollment into MDM technology keep their M1 Macs secure.
A head of corporate IT in the financial services industry said: “We haven’t had any malware incidents in the three years since we moved to a 100% Mac deployment. We can see the traction and retention benefits, the productivity, and the innovation that Macs enable. But, ultimately, we went with Mac for security, and it’s very strong.”
With M1 Macs, the composite organization improves its retention rate by 20%, reduces start-up times by 80% leading to 48 hours of increased productivity over three years, and increased the productivity of all employees by 5%, leading to an additional 104 hours of additional productivity for Mac users annually. Interviewees generally reported increased employee satisfaction, and they said employees who choose Mac are less likely to leave. Additionally, the performance improvements across all tasks in the MacBook Air M1, the extended battery life, and the elimination of a fan make employees more productive and decreases the number of interruptions per day.
An IT director in the retail industry said: “Everything is just faster, and you spend less time waiting for small things on M1. By eliminating all of those pain points, it feels much more powerful, and it really improves the experience overall.”
Unquantified benefits.Benefits that are not quantified for this study include:
Some interviewees said their organizations tested app compatibility between iOS and iPadOS applications and M1 Macs, and saw promising results. The IT director in retail said: “We have quite a few operational iOS apps, and those are the apps that we could see some real benefits from being able to run them natively on M1 Macs. It would reduce the need for custom development work and also reduce the total number of devices because an employee would be able to do everything they need on the Mac.”
Organizations are increasingly setting environmental, social, and governance (ESG) goals or other environmental goals both publicly and internally in an attempt to reduce their impacts on the environment. In the 2019 study, Forrester found that Mac devices generally consume less electricity than their PC counterparts, and studies on the new M1 Macs show that M1 Macs create significantly less carbon dioxide (CO2) than previous Macs and PCs. Extrapolated to hundreds or thousands of devices, these savings can lead to significant ESG improvements.
One interviewee said their organization used the reduced CO2 consumption data to help drive Mac adoption internally. Each department head had a portion of their bonus tied to ESG goals, and decision-makers considered using Mac to be an easy win to reduce environmental impacts and to show improvements.
A director in the technology industry said: “We have sustainability goals across all units, and people haven’t yet thought about the impact that their actual devices can have. So that is where we are trying to focus. We look at each group’s most commonly deployed PC devices, and we bring data to show how Macs can improve their ESG performance with recycled aluminum and reduced power consumption.”
When organizations set up mergers or make acquisitions, integrating human and IT resources is a crucial step in realizing value from the investment.
For organizations with an existing Mac deployment, integrating new Macs can be as simple as enrolling each device in the MDM. But integrating new Mac devices without an existing Mac deployment may be more challenging, may take longer, and may reduce the effectiveness of the Macs if unnecessary tools and software are loaded onto the devices.
The director in the technology industry said: “We made a significant acquisition, but nobody stopped to consider that the company we acquired was a Mac shop. Luckily, we had our choice program in place with experience managing Macs. So, the first thing we were able to do as part of the [acquisition] was integrate the Mac devices. We simply enrolled all of the devices in our MDM and Apple Business Manager so all the Mac users at the acquired company could use our resources as long as they had an internet connection. This easy integration was not possible with PC devices.”
Costs.The following costs reflect the three-year financial analysis associated with the composite organization to support 33,000 Macs:
These costs come from professional services for implementation, internal labor for implementation, and internal labor for ongoing platform support. Interviewees from organizations with experience deploying Macs or iOS devices said their firms typically required no professional services or less than would have been previously required. However, interviewees also noted that it is important to ensure Macs are deployed according to Apple’s best practices to maximize the value of the Mac deployment, and they recommended working with a third party or internal advisor.
These costs include hardware and deployment costs associated with Macs, third-party MDM costs, incremental costs for additional Mac peripherals (e.g., dongles, connectors), and AppleCare extended warranties and enterprise support.
The composite organization reduces the average device cost per Mac from $1,700 (as detailed in the 2019 study) to $1,500 in 2021 because it now has the ability to deploy a MacBook Air with M1 at a lower price point to more employees. This reduces overall costs while delivering more computing power to workers.
The customer interviews and financial analysis found that a composite organization experiences benefits of $131.4 million over three years versus costs of $30.1 million, adding up to a net present value (NPV) of $101.3 million and an ROI of 336%.
The objective of the framework is to identify the cost, benefit, flexibility, and risk factors that affect the investment decision. Forrester took a multistep approach to evaluate the impact that the Mac can have on an organization.
Forrester Consulting conducted an online survey of 351 cybersecurity leaders at global enterprises in the US, the UK, Canada, Germany, and Australia. Survey participants included managers, directors, VPs, and C-level executives who are responsible for cybersecurity decision-making, operations, and reporting. Questions provided to the participants sought to evaluate leaders' cybersecurity strategies and any breaches that have occurred within their organizations. Respondents opted into the survey via a third-party research panel, which fielded the survey on behalf of Forrester in November 2020.
Interviewed Apple stakeholders and Forrester analysts to gather data relative to the Mac.
Interviewed decision-makers at organizations using the Mac to obtain data with respect to costs, benefits, and risks.
Designed a composite organization based on characteristics of the interviewed organizations.
Constructed a financial model representative of the interviews using the TEI methodology and risk-adjusted the financial model based on issues and concerns of the interviewed organizations.
Employed four fundamental elements of TEI in modeling the investment impact: benefits, costs, flexibility, and risks. Given the increasing sophistication of ROI analyses related to IT investments, Forrester’s TEI methodology provides a complete picture of the total economic impact of purchase decisions. Please see Appendix A for additional information on the TEI methodology.
Readers should be aware of the following:
This study is commissioned by Apple and delivered by Forrester Consulting. It is not meant to be used as a competitive analysis.
Forrester makes no assumptions as to the potential ROI that other organizations will receive. Forrester strongly advises that readers use their own estimates within the framework provided in the study to determine the appropriateness of an investment in the Mac.
Apple reviewed and provided feedback to Forrester, but Forrester maintains editorial control over the study and its findings and does not accept changes to the study that contradict Forrester’s findings or obscure the meaning of the study.
Apple provided the customer names for the interviews but did not participate in the interviews.
Industry | Region | Interviewee | Employees | Mac Deployment |
---|---|---|---|---|
Retail | Global | IT director | 1,450 | 1,400 |
Technology | Global | Director; manager of native app experiences | 100,000 | 30,000 |
Healthcare | The Netherlands | Head of Mac deployment; team lead of end user computing | 13,000 | 1,400 |
Utility | Italy | Manager of infrastructure, cloud services, and network management | 5,000 | 2,500 |
Financial services | Global | Head of corporate IT | 3,000 | 3,000 |
Financial services | Global | Platform manager | 100,000+ | 2,000 |
Healthcare | North America and EMEA | Endpoint services director | 100,000+ | 5,000 |
Manufacturing | Global | IT manager | 50,000 | 500 |
Technology | Global | CIO | 100,000+ | 20,000+ |
Technology | Global | Platform manager; service manager | 75,000 | 20,000+ |
Interviewees said their organizations had not sanctioned Macs or bring-your-own-device (BYOD) programs prior to implementing an employee choice program for Mac.
The organizations struggled with common challenges, including:
Interviewees said their organizations were tired of using old PC imaging processes and setting up appointments with IT to receive a new device because those processes consumed precious time and resources from both IT employees and end users.
A manager of infrastructure, cloud services, and network management in the utilities industry said: “The big difference [between Mac and PC deployment] is that the Mac is activated with a zero-touch deployment. As an IT department, we don’t have to manage anything about the activation because the employee can just activate it by themselves by following the enrollment procedure. This is a completely different experience than with PCs, where employees have to set up an appointment and wait for one of us to give them support.”
The IT director in the retail industry shared a common theme from the interviews: “The one thing I can say specifically about our PCs is that we’re not getting the longevity out of them that we’re getting out of our Macs. We’re replacing PCs every two to two-and-a-half years while we push a lot of our Macs to four or five-plus years.”
The interviewees said their organizations searched for a solution that could:
The IT director in the retail industry said: “When we put people on M1 [devices], they tend to go radio silent from a support perspective. Everything just works. It is a much more stable platform.”
A manager of infrastructure, cloud services, and network management in the utilities industry said: “We looked to the future and realized that we need to be able to attract and retain our talent — especially younger workers. We think [using] Mac is a good way to help attract and retain those employees.”
An endpoint services director in the healthcare industry stated: “Our executives looked over at our CISO and asked, ‘As a result of moving to Mac in our enterprise, are we going to be more secure from a workstation perspective?’ And his answer was simply ‘Yes.’”
Interviewees said their organizations saw several impacts from deploying M1 Macs. These include:
The IT director in the retail industry said, “The short-term benefits are that we’re going to be able to reduce our replacement footprint with lower cost computers for a portion of our staff and that is pretty huge for us from a forecasting and budgeting perspective.”
The IT director in the retail industry said: “I use an M1, and I love it. It’s fantastic. It’s the best laptop that Apple has made in a very long time.”
The director in the technology industry said: “From a performance perspective, the MacBook Air with M1 is impressive. The battery lasts forever. I don’t have the feeling that I miss out on anything.”
The IT director in the retail industry said: “We have received really positive feedback on the M1 across the board. All our users who have them love them, and they rave about the battery life and how fast they are. I see the productivity benefit on my side, too. I work with a lot of big reports and a lot of complex IT software, and I spend a lot less time waiting for small things than I used to. There is a speed improvement across the board.”
Based on the interviews, Forrester constructed a TEI framework, a composite company, and an ROI analysis that illustrates the areas financially affected. The composite organization is representative of the interviewees’ organizations, and it is used to present the aggregate financial analysis in the next section. The composite organization has the following characteristics:
The composite is a global organization headquartered in North America with 100,000 employees, and it has a high penetration and adoption rate of iOS. Some employees had been using Mac in an unsupported state outside of corporate policy, so IT does not manage those machines. There were no formal infrastructures or best practices in place for an employee choice program, so decision-makers chose to implement its own.
During the first three years, the composite organization deploys Macs to 33,000 employees (roughly one-third of its total employees) as 10,000 employees select Mac in Year 1, 11,000 select Mac in Year 2, and 12,000 select Mac in Year 3. The organization deploys Mac devices to new hires or as part of employees' standard device refresh cycles. These devices are financed through Apple Finance on a three-year lease. Employees have a range of device options to select from based on their roles and specific functions. Options include both PC and Mac devices in a predetermined performance tier, baseline devices (with starting prices of $1,000), mid-range devices (with starting prices of $1,600), and high-end devices (with starting prices of $2,400. Decision-makers consider the MacBook Air with M1 to be more suitable as a baseline device for a wide range of employees than devices typical of the baseline category due to its power efficiency and performance.
Note that many of the benefits modeled for the composite organization are achievable while a company scales up its Mac deployment.
The information on this page is based on data collected from organizations that deployed Macs in their environments and increased their Mac footprints annually.
Composite Organization Context
The financial model is based on a composite organization that was constructed with the following details:
Decision-makers anticipate deploying Mac to 33% of the organization’s workforce during three years of an employee choice program. Both PC and Mac deployments consist of multiple device types at multiple price points to fit the needs of various teams and functions.
The organization deploys 100,000 computer devices (one device per employee) during the three-year period. It deploys 10% of the devices (10,000 devices) in Year 1, 21% (11,000 devices) in Year 2, and 33% (12,000 devices) in Year 3.
During the three-year timeframe, the organization deploys a total of 33,000 Macs vs. 67,000 PCs.
For this scenario and to make a clear comparison, Forrester only leveraged the data available in the financial model, and we examined the forecasted costs to acquire, secure, and maintain each device over three years.
Combining the costs of hardware, software, support, and operations over three years leads to a cumulative cost advantage for Mac deployments. Note that each benefit and cost category has a modeled risk adjustment as described in the benefit and cost sections of the TEI.
The primary differences between the M1 Macs and other Mac devices are improved performance at lower price points. This allows organizations to deploy lower price point devices to a wider range of employees without sacrificing performance, reducing the average cost of each device. The composite organization sees ongoing costs of management and support drop with improved reliability of M1 Macs.
Metric | PC | Mac |
---|---|---|
Provisioning | $43 | $3.58 |
Service tickets and resolution | $540 | $162 |
Additional general IT management | $758.60 | $500.06 |
Energy costs | $42 | $14 |
Risk adjustment | $0 | $69 |
Total | $1,383.60 | $748.64 |
Differential | $634.96 |
Metric | PC | Mac |
---|---|---|
Device costs | $1,200 | $1,500 |
Incremental required software | $570 | $120 |
Incremental peripherals | $0 | $50 |
Residual value % | 10% | 25% |
Residual value $ | ($120) | ($375) |
Risk adjustment | ($83) | $64.75 |
Total | $1,567.50 | $1,359.75 |
Differential | $207.75 |
Source: A commissioned Forrester Consulting study based on data from 10 organizations that currently deploy Macs and have increased their Mac deployment annually.
Ref. | Benefit | Year 1 | Year 2 | Year 3 | Total | Present Value |
---|---|---|---|---|---|---|
Atr | Reduced IT support and operational costs | $2,414,880 | $5,071,248 | $7,969,104 | $15,455,232 | $12,373,765 |
Btr | Reduced and avoided costs | $12,144,800 | $15,255,252 | $18,558,174 | $45,958,226 | $37,591,404 |
Ctr | Reduced risk of a data breach | $878,852 | $1,845,589 | $2,900,211 | $5,624,652 | $4,503,208 |
Dtr | Improved employee productivity and engagement | $15,012,800 | $31,526,880 | $49,542,240 | $96,081,920 | $76,925,091 |
Total benefits (risk-adjusted) | $30,451,332 | $53,698,969 | $78,969,729 | $163,120,030 | $131,393,468 |
The interviewees said zero-touch deployment of Macs reduced provisioning time and effort, Mac users create fewer support tickets, and the tickets that do come in are cheaper to resolve than those for PCs. This enabled IT teams to manage more Macs with fewer FTEs compared to the requirements for PCs. Interviewees said:
IT teams required less time to provision each Mac because devices were shipped directly to the employees, and all applications and relevant policies were automatically downloaded and managed via a third-party MDM platform. This process also involved leveraging Apple’s device enrollment feature of Apple Business Manager.
Mac users opened fewer service tickets compared to their PC-using counterparts due to self-service capabilities on Mac, and they experienced fewer issues with performance overall. Interviewees also said Mac users tend to be more self-sufficient and motivated to resolve issues.
Service tickets that were opened for Mac were easier to resolve because there is less complexity with the Mac ecosystem than there is with PCs. Additionally, there were fewer hardware-related issues with Macs and fewer dependencies on multiple vendors to perform each task — especially among users of M1 Macs.
An IT FTE can manage more Mac devices than PCs, which means the organizations’ Mac deployments could be managed by a smaller team relative to PC deployments. Mac has a simplified tool set, more automation, and Apple automatically pushes updates and patches for its OS and some applications to every device. Additionally, Mac devices typically require less overall attention from IT during the course of the lifecycle.
Based on the customer interviews, Forrester estimates the following for the composite organization:
It takes an IT employee 5 minutes to set up a Mac for provisioning as opposed to 60 minutes for a PC. Additionally, Macs receive major operating system updates and patches annually though Apple, so the savings from automated software updates accrue on an annual basis.
Ten percent of the organization’s employees (10,000 employees) choose Mac instead of PC as their new or replacement machine in Year 1. This increases to 11% in Year 2 and to 12% in Year 3. By the end of Year 3, 33% of the organization (33,000 employees) use a Mac.
The average fully burdened hourly salary for an IT FTE is $43. Note that Forrester used conservatives estimates for salaries.
Each PC user creates an average of six support tickets per year, and each ticket costs $30 to resolve. Mac users create 60% fewer tickets than PC users, and each ticket costs 25% less to resolve than those for PCs. Because Apple maintains control over the hardware and the operating system, it tends to be easier for IT to resolve issues and with fewer errors. This means it requires fewer steps to resolve any given issue on a Mac vs. a PC.
An IT FTE can manage an average of 200 PCs compared to 500 Mac devices (with best-practice deployments of enterprise Macs).
Forrester included the reduced provisioning and service ticket effort associated with Macs in the machine-to-FTE ratio. These benefits are subtracted from this benefit in the final quantification to avoid double-counting.
The value of this benefit can vary among organizations due to:
The average fully burdened salary of an IT FTE.
Whether or not the organization uses Apple's best practices in deploying Mac in the enterprise.
To account for these risks, Forrester adjusted this benefit downward by 10%, yielding a three-year, risk-adjusted total PV (discounted at 10%) of $12.4 million.
Ref. | Metric | Source | Year 1 | Year 2 | Year 3 | ||
---|---|---|---|---|---|---|---|
A1 | Time required to provision a PC (minutes) | Composite | 60 | 60 | 60 | ||
A2 | Time required to provision a Mac (minutes) | Composite | 5 | 5 | 5 | ||
A3 | Number of Macs provisioned | B3 | 10,000 | 11,000 | 12,000 | ||
A4 | Average fully burdened hourly salary per IT FTE (rounded) | Composite | $43 | $43 | $43 | ||
A5 | Subtotal: Reduced hourly salary per IT FTE (rounded) | (A1-A2)/60*A3*A4 | $394,167 | $433,583 | $473,000 | ||
A6 | Average number of tickets per PC per year | Composite | 6 | 6 | 6 | ||
A7 | Reduced number of tickets per Mac | Composite | 60% | 60% | 60% | ||
A8 | Average cost to resolve tickets per PC | Composite | $30 | $30 | $30 | ||
A9 | Reduced cost to resolve tickets per Mac | Composite | 25% | 25% | 25% | ||
A10 | Support costs for PCs | D1*D2*A6*A8 | $1,800,000 | $3,780,000 | $5,940,000 | ||
A11 | Support costs for Macs | D1*D2*A6*A7*A8*(1-A9) | $810,000 | $1,701,000 | $2,673,000 | ||
A12 | Subtotal: Reduced support costs | A10-A11 | $990,000 | $2,079,000 | $3,267,000 | ||
A13 | Number of PCs managed per IT FTE | Composite | 200 | 200 | 200 | ||
A14 | Number of Macs managed per IT FTE | Composite | 500 | 500 | 500 | ||
A15 | Subtotal: Reduced management costs (rounded) | ((D1*D2/A13) - (D1*D2/A14))*A4*2,080-A5-A12 | $1,299,033 | $3,122,137 | $5,114,560 | ||
At | Reduced IT support and operational costs | A5+A12+A15 | $2,683,200 | $5,634,720 | $8,854,560 | ||
Risk adjustment | ↓10% | ||||||
Atr | Reduced IT support and operational costs (risk-adjusted) | $2,414,880 | $5,071,248 | $7,969,104 | |||
Three-year total: $15,455,232 | Three-year present value: $12,373,765 | ||||||
View MoreView Less
|
With the improved power efficiency and performance delivered by Macs with M1, the interviewees’ organizations can offer M1 Macs to more employees, including those who were previously assigned higher-priced devices.
The M1 chip allowed the organizations to offer Macs to more employees, including baseline users. In the 2019 study, interviewees said their organizations primarily deployed Mac to mid-tier and top-tier users who needed the additional computing power and speed and those who preferred Macs.
On average, a Mac costs more up front than a PC, but the average purchase price for a Mac has dropped significantly when looking at the total deployment. This difference is partially offset by the cost of a comparable PC that the employee would have otherwise needed to order if there was no Mac available.
Using Macs did not require the organizations to purchase an operating system license or any software update maintenance because Apple automatically pushes out OS updates.
The underlying architecture of Mac and the included security features eliminated the need for some additional endpoint security licenses that are required to secure comparable PC deployments. Additionally, Apple automatically pushes out security patches for Mac at no cost.
Non-M1 Macs require 50% less energy than PCs, and M1 Macs require 50% less energy than non-M1 Macs.
Based on the customer interviews, Forrester estimates the following for the composite organization:
The percent of employees who choose Mac annually is 10% in Year 1, 11% in Year 2, and 12% in Year 3.
The average cost for an enterprise PC is $1,200, and that machine maintains a 10% residual value after three years. This $1,200 figure represents an average of all deployed PCs, including baseline devices and more expensive top-tier devices.
The average OS license cost for a PC is $150 per year.
Additional endpoint security licenses for PCs cost an average of $40 per year per machine.
Each Mac requires 50% less energy to operate than a PC, and M1 Macs require 75% less energy on average than a PC.
M1 Macs make up 40% of the organization’s total Mac deployment in Year 1, 55% of its total Mac deployment in Year 2, and 65% of its total Mac deployment in Year 3.
Forrester did not include any incremental security benefits related to Apple’s M1 chip in this analysis because the interviewees’ organizations did not have enough time to assess the differences between M1 Macs and non-M1 Macs.
The value of this benefit may vary among organizations due to:
The number of employees who choose Mac.
The average cost of an enterprise PC and the residual value after three years.
The number of an organization’s endpoint licenses, which may vary depending on which endpoint solutions are replaced due to Mac’s underlying architecture and included security features.
Additional OS and security license costs for PCs.
To account for these risks, Forrester adjusted this benefit downward by 5%, yielding a three-year, risk-adjusted total PV of $37.6 million.
Ref. | Metric | Source | Year 1 | Year 2 | Year 3 | ||
---|---|---|---|---|---|---|---|
B1 | Total employees | Composite | 100,000 | 100,000 | 100,000 | ||
B2 | Percentage of employees who choose Mac | Composite | 10% | 11% | 12% | ||
B3 | Number of employees who choose Mac | B1*B2 | 10,000 | 11,000 | 12,000 | ||
B4 | Cumulative Macs deployed | D1*D2 | 10,000 | 21,000 | 33,000 | ||
B5 | Average cost per PC | Composite | $1,200 | $1,200 | $1,200 | ||
B6 | Residual value for PCs after three years | Composite | 10% | 10% | 10% | ||
B7 | Additional OS license costs | Composite | $150 | $150 | $150 | ||
B8 | Additional endpoint security licenses | Composite | $40 | $40 | $40 | ||
B9 | Subtotal: Avoided PC costs | ((B3*B5)-(B3*B5*B6))+(B4*(B7+B8)) | $12,700,000 | $15,870,000 | $19,230,000 | ||
B10 | Annual energy costs per PC | 60W, 8h a day | $14 | $14 | $14 | ||
B11 | Percentage of total Macs deployed with M1 | Composite | 40% | 55% | 65% | ||
B12 | Legacy Mac consumption | 30W, 8h a day | $7 | $7 | $7 | ||
B13 | M1 consumption | 15W, 8h a day | $3 | $3 | $3 | ||
B14 | Reduced energy costs per Mac (2019 findings) (rounded) | ((50%*(1-B11))+(75%*B11) | 60% | 64% | 66% | ||
B15 | Subtotal: Reduced energy costs | B10*B14*B4 | $84,000 | $188,160 | $304,920 | ||
Bt | Reduced and avoided hardware and software costs | B9+B15 | $12,784,000 | $16,058,160 | $19,534,920 | ||
Risk adjustment | ↓5% | ||||||
Btr | Reduced and avoided hardware and software costs (risk-adjusted) | $12,144,800 | $15,255,252 | $18,558,174 | |||
Three-year total: $45,958,226 | Three-year present value: $37,591,404 | ||||||
View MoreView Less
|
Interviewees noted that they consider Mac to be a fundamentally more secure architecture than their PCs. They cited Mac’s built-in security architecture, automatic encryption, and ease of enrollment in device management platforms as reasons for the improved security.
Apple implemented a new endpoint security framework that allows optional third-party security tools to run in a more secure part of the operating system. This enhanced, built-in security feature helped the organizations to reduce opening low-level access to third parties that have been used as attack vectors themselves.
M1 Macs have a fully vertically integrated architecture, and although the interviewees’ organizations have not fully tested their security efficacy, early results indicated that M1 Macs are at least as secure as the previous generation of Macs, and they can be managed the same way.
The interviewees’ organizations had fewer security incidents and alerts with their Mac deployments than with their PC deployments.
One interviewee said their organization has had zero malware incidents since moving to a 100% Mac deployment three years earlier.
Based on the customer interviews and Forrester research, Forrester estimates the following for the composite organization:
The composite organization experiences an average of 2.5 data breaches annually2.
The average cost of a security breach is $6.1 million, which includes fines, fees, and the cost of remediation efforts. This average cost excludes internal user downtime related to the breach.
Mac deployment in the enterprise is 10% in Year 1, 21% in Year 2, and 33% in Year 3.
Mac reduces the likelihood of a data breach by 50% per device.
Each security breach leads to 3.6 hours of user downtime and impacts 20% of the organization.
The average fully burdened hourly salary for a worker is $38.
The value of this benefit may vary among organizations due to:
The average number of breaches experienced annually.
The overall scale and impact of a data breach.
The adoption of Mac at the organization.
To account for these risks, Forrester adjusted this benefit downward by 20%, yielding a three-year, risk-adjusted total PV of $4.5 million.
Ref. | Metric | Source | Year 1 | Year 2 | Year 3 | ||
---|---|---|---|---|---|---|---|
C1 | Average number of data breaches per year per organization with 100,000 FTE | Forrester research | 2.5 | 2.5 | 2.5 | ||
C2 | Average potential cost of a data breach, exclusive of internal user downtime | Forrester research | $6,052,518 | $6,052,518 | $6,052,518 | ||
C3 | Percentage of employees using Mac | D2 | 10.00% | 21.00% | 33.00% | ||
C4 | Reduced likelihood of data breach with Mac | Composite | 50% | 50% | 50% | ||
C5 | Number of data breaches avoided with Mac deployment - annually | C1-((C1*(1-C3))+(C1*C3*C4)) | 0.13 | 0.26 | 0.41 | ||
C6 | % of data breaches avoided with Mac deployment - annually | C5/C1 | 5.0% | 10.5% | 16.5% | ||
C7 | Subtotal: Avoided costs of remediation, customer resolution, fines, brand rebuild, and all other external facing costs (rounded) | C1*C2*C3*C4 | $756,565 | $1,588,786 | $2,496,664 | ||
C8 | Cumulative number of Macs deployed | B4 | 10,000 | 21,000 | 33,000 | ||
C9 | Average fully burdened hourly employee salary | D7 | $38 | $38 | $38 | ||
C10 | Diminished/eliminated internal user productivity hours per breach | Forrester research | 3.6 | 3.6 | 3.6 | ||
C11 | Average percentage of employees affected per breach | Composite | 20% | 20% | 20% | ||
C12 | Subtotal: Cost of reduced internal productivity | C1*C4*C8*C9*C10*C11 | $342,000 | $718,200 | $1,128,600 | ||
Ct | Reduced risk of a data breach | C7+C12 | $1,098,565 | $2,306,986 | $3,625,264 | ||
Risk adjustment | ↓20% | ||||||
Ctr | Reduced risk of a data breach (risk-adjusted) | $878,852 | $1,845,589 | $2,900,211 | |||
Three-year total: $5,624,652 | Three-year present value: $4,503,208 | ||||||
View MoreView Less
|
Interviewees said their organizations saw faster start-up times, improved productivity and engagement, and reduced churn for employees who selected Mac.
Improved machine performance including faster start-up times, improved processing speed, and improved battery life all contributed to improving employee productivity and experience with Mac at the interviewees’ organizations.
The organizations realized improved employee engagement due to offering employees the ability to select Mac as their preferred device. Improved engagement led to an increase in discretionary effort from Mac users, which translated into an overall productivity gain.
Improved employee engagement from employees using their preferred devices also led to a tangible improvement in retention rates for those employees that selected Mac.
Based on the customer interviews, Forrester estimates for the composite organization:
Ten percent of the composite organization’s 100,00 employees choose Mac in Year 1. This increases to 21% in Year 2, and to 33% in Year 3.
Each employee who uses a PC spends an average of 5 minutes per day waiting for tasks like waking or rebooting the computer and loading large files. Mac users spend an average of 1 minute per day waiting for these tasks.
The average fully burdened annual salary of an employee is $78,000.
The organization reallocates 20% of the time savings toward productive work.
The organization sees a 5% increase in productivity and performance for employees who choose Mac. This equates to 104 hours of additional productivity for Mac users annually.
According to customers in the 2019 study, sales teams typically see a 5% improvement by using Macs. With the additional data collected from customers for this update, Forrester now extends this benefit to all employees who deploy Mac. Interviewees said Mac users have higher engagement and better performance than PC users, regardless of role.
The organization reallocates 20% of the time savings toward productive work.
Forrester attributed 75% of this benefit specifically to the Mac deployment. The rest of the benefit is attributed to talent, organizational structure, and developing efficient workflows.
The average employee churn rate for employees who don’t choose Mac prior to the deployment is 15%.
There is a 20% improvement in retention for employees who choose Mac.
It costs 50% of an employee’s salary to replace an employee due to attrition. This is a conservative estimate compared to industry research performed by the Society for Human Resource Management3.
The value of this benefit may vary among organizations due to:
The number of employees who choose Mac and their average burdened salaries.
The salaries of employees.
Productivity capture.
Improvements in employee productivity, performance, and retention.
The cost to replace an employee.
To account for these risks, Forrester adjusted this benefit downward by 20%, yielding a three-year, risk-adjusted total PV of $76.9 million.
Ref. | Metric | Source | Year 1 | Year 2 | Year 3 | ||
---|---|---|---|---|---|---|---|
D1 | Number of employees | Composite | 100,000 | 100,000 | 100,000 | ||
D2 | Percentage of employees using Mac | Composite | 10.0% | 21.0% | 33.0% | ||
D3 | Average time for PC wake/reboot daily (minutes) | Composite | 5 | 5 | 5 | ||
D4 | Average time for Mac wake/reboot daily (minutes) | Composite | 1 | 1 | 1 | ||
D5 | Average work days per year | Composite | 240 | 240 | 240 | ||
D6 | Average fully burdened annual employee salary | Composite | $78,000 | $78,000 | $78,000 | ||
D7 | Average fully burdened hourly employee salary | Composite | $38 | $38 | $38 | ||
D8 | Productivity capture | Assumption | 20% | 20% | 20% | ||
D9 | Subtotal: Improved productivity from quicker start-up | D1*D2*(D3-D4) /60*D5*D7*D8 | $1,216,000 | $2,553,600 | $4,012,800 | ||
D10 | Number employees using Mac | D1*D2 | 10,000 | 21,000 | 33,000 | ||
D11 | Average fully burdened annual employee salary | D6 | $78,000 | $78,000 | $78,000 | ||
D12 | Increased productivity for employees who choose Mac | Campsite | 5% | 5% | 5% | ||
D13 | Productivity capture | Composite | 20% | 20% | 20% | ||
D14 | Attribution | Composite | 75% | 75% | 75% | ||
D15 | Subtotal: Improved productivity | D10*D11*D12*D13*D14 | $5,850,000 | $12,285,000 | $19,305,000 | ||
D16 | Average employee churn rate for employees who don’t choose Mac | Composite | 15% | 15% | 15% | ||
D17 | Improvement in retention with employees who choose Mac | Composite | 20% | 20% | 20% | ||
D18 | Cost to replace an employee | D6*50% | $39,000 | $39,000 | $39,000 | ||
D19 | Subtotal: Improved employee retention | D1*D2*D16*D17*D18 | $11,700,000 | $24,570,000 | $38,610,000 | ||
Dt | Improved employee productivity and engagement | D9+D15+D19 | $18,766,000 | $39,408,600 | $61,927,800 | ||
Risk adjustment | ↓20% | ||||||
Dtr | Improved employee productivity and engagement (risk-adjusted) | $15,012,800 | $31,526,880 | $49,542,240 | |||
Three-year total: $96,081,920 | Three-year present value: $76,925,091 | ||||||
View MoreView Less
|
Ref. | Cost | Initial | Year 1 | Year 2 | Year 3 | Total | Present Value |
---|---|---|---|---|---|---|---|
Etr | Implementation and labor costs | $136,620 | $308,568 | $308,568 | $308,568 | $1,062,324 | $903,983 |
Ftr | Hardware and hardware deployment costs | $0 | $5,191,952 | $12,120,800 | $19,258,450 | $36,571,202 | $29,206,305 |
Total costs (risk-adjusted) | $136,620 | $5,500,520 | $12,429,368 | $19,567,018 | $37,633,526 | $30,110,288 |
Interviewees said their organizations incurred implementation and labor costs in the following areas:
The interviewees’ organizations required little or no professional services to support the implementation due to existing familiarity with deploying Macs in the past. Interviewees recommended working with a third-party firm or an internal expert to ensure that organizations effectively capture the value of the Mac investment by following Apple’s best practices for deployment and by avoiding unnecessary bloatware.
The interviewees noted that the provisioning process for Mac required minimal IT resources. Deploying Macs to employees was almost a zero-touch experience. The manager of infrastructure, cloud services, and network management in the utilities industry said: “As an IT department, we don’t have to manage anything about the activation of the Mac because the employee can activate the Mac by themselves by following enrollment procedures. Then, all the business applications and software are directly installed on the Mac.”
Ongoing management was a minimal lift for the interviewees’ organizations. They saw fewer service tickets from Mac users in general and a significant decrease from those using M1 Macs. This allowed each IT resource to manage more Mac devices. The average number of IT personnel responsible for ongoing management activities (e.g., managing patches and inventory) at the interviewees’ organizations range from one to 10 FTEs.
Based on the customer interviews, Forrester assumes the following about the composite organization:
The costs of implementation and labor may vary among organizations due to:
To account for these risks, Forrester adjusted this cost upward by 15%, yielding a three-year, risk-adjusted total PV (discounted at 10%) of under $904,000.
Ref. | Metric | Source | Initial | Year 1 | Year 2 | Year 3 | |
---|---|---|---|---|---|---|---|
E1 | Professional services | Composite | $50,000 | ||||
E2 | Internal implementation FTEs | Composite | 2 | ||||
F3 | Average fully burdened hourly salary per IT FTE | A4 | $43 | $43 | $43 | $43 | |
E4 | Implementation time (weeks) | Composite | 20 | ||||
E5 | Ongoing platform support FTEs | Composite | 3 | 3 | 3 | ||
Et | Implementation and labor costs | E1+(E2*E3*E4*40)+(E5*E3*2080) | $118,800 | $268,320 | $268,320 | $268,320 | |
Risk adjustment | ↑15% | ||||||
Etr | Implementation and labor costs (risk-adjusted) | $136,620 | $308,568 | $308,568 | $308,568 | ||
Three-year total: $1,062,324 | Three-year present value: $903,983 | ||||||
View MoreView Less
|
Interviewees said their organizations incurred hardware and hardware deployment costs in the following areas:
With the introduction of the M1, the organizations were able to deploy MacBook Air devices with M1 at a lower cost to more of their employees. This reduced average machine costs while delivering a more powerful baseline device to the workforce. Consistent with the 2019 study, interviewees for this update said Macs provide significant residual value and some of the organizations do not need to replace their devices until after more than five years of usage.
The majority of the interviewees’ organizations used third-party MDM services to deploy and update devices and applications for employees. Interviewees noted that MDM costs for Mac are less than those for PCs.
The interviewees’ organizations incurred expenses for Mac peripherals (e.g., dongles, connectors) and AppleCare extended warranties and enterprise support.
Based on the customer interviews, Forrester assumes the following about the composite organization:
The costs of hardware and hardware deployment may vary among organizations due to:
To account for these risks, Forrester adjusted this cost upward by 15%, yielding a three-year, risk-adjusted total PV of $29.2 million.
Ref. | Metric | Source | Initial | Year 1 | Year 2 | Year 3 | |
---|---|---|---|---|---|---|---|
F1 | Number of Macs deployed | B3 | 0 | 10,000 | 11,000 | 12,000 | |
F2 | Cumulative Macs deployed | B4 | 0 | 10,000 | 21,000 | 33,000 | |
F3 | Average cost per Mac | Composite | $0 | $1,600 | $1,500 | $1,400 | |
F4 | Average cost for additional Mac peripherals | Composite | $0 | $50 | $50 | $50 | |
F5 | Average cost for AppleCare per Mac | Composite | $0 | $129 | $129 | $129 | |
F6 | Subtotal: Annual cost of peripherals and AppleCare for new Macs | F1*(F4+F5) | $0 | $1,790,000 | $1,969,000 | $2,148,000 | |
F7 | Average annual cost per Mac with F7 payments set during three years (rounded) | F3/3 | $0 | $533 | $500 | $467 | |
F8 | Average annual third-party MDM cost per mac | Composite | $0 | $40 | $40 | $40 | |
F9 | Subtotal: Annual device and MDM costs | F2*(F7+F8)+Year 1 installment+ Year 2 installment | $0 | $5,730,000 | $11,670,000 | $17,754,000 | |
F10 | Residual value of a Mac after 3 years | Composite | 0% | 25% | 25% | 25% | |
F11 | Subtotal: Residual value (three-year PV) | F1*F3*F10, three-year PV | $0 | $3,005,259 | $3,099,174 | $3,155,522 | |
Ft | Hardware and hardware deployment costs | F6+F9-F11 | $0 | $4,514,741 | $10,539,826 | $16,746,478 | |
Risk adjustment | ↑15% | ||||||
Ftr | Hardware and hardware deployment costs (risk-adjusted) | $0 | $5,191,952 | $12,120,800 | $19,258,450 | ||
Three-year total: $36,571,202 | Three-year present value: $29,206,305 | ||||||
View MoreView Less
|
These risk-adjusted ROI, NPV, and payback period values are determined by applying risk-adjustment factors to the unadjusted results in each Benefit and Cost section.
Initial | Year 1 | Year 2 | Year 3 | Total | Present Value | |
---|---|---|---|---|---|---|
Total costs | ($136,620) | ($5,500,520) | ($12,429,368) | ($19,567,018) | ($37,633,526) | ($30,110,288) |
Total benefits | $0 | $30,451,332 | $53,698,969 | $78,969,729 | $163,120,030 | $131,393,468 |
Net benefits | ($136,620) | $24,950,812 | $41,269,600 | $59,402,712 | $125,486,504 | $101,283,180 |
ROI | 336% | |||||
Payback period | <6 months | |||||
View MoreView Less
|
The financial results calculated in the Benefits and Costs sections can be used to determine the ROI, NPV, and payback period for the composite organization’s investment. Forrester assumes a yearly discount rate of 10% for this analysis.
Total Economic Impact is a methodology developed by Forrester Research that enhances a company’s technology decision-making processes and assists vendors in communicating the value proposition of their products and services to clients. The TEI methodology helps companies demonstrate, justify, and realize the tangible value of IT initiatives to both senior management and other key business stakeholders.
Benefits represent the value delivered to the business by the product. The TEI methodology places equal weight on the measure of benefits and the measure of costs, allowing for a full examination of the effect of the technology on the entire organization.
Costs consider all expenses necessary to deliver the proposed value, or benefits, of the product. The cost category within TEI captures incremental costs over the existing environment for ongoing costs associated with the solution.
Flexibility represents the strategic value that can be obtained for some future additional investment building on top of the initial investment already made. Having the ability to capture that benefit has a PV that can be estimated.
Risks measure the uncertainty of benefit and cost estimates given: 1) the likelihood that estimates will meet original projections and 2) the likelihood that estimates will be tracked over time. TEI risk factors are based on “triangular distribution.”
"Improve Your Threat Protection Efficacy Using Built-In OS Security", Forrester Research, Inc., December 2, 2020
"Improve Employee Experience To Better Your Business Performance", Forrester Research, Inc., March 12, 2021
"Design For Work: Boost Productivity And Satisfaction By Transforming Enterprise UX", Forrester Research, Inc., October 7, 2020
1 Source: "Best Practices: Technology Experience Management", Forrester Research, Inc., April 8, 2021.
2 Source: Forrester Consulting Cost Of A Cybersecurity Breach Survey, Q4 2020.
3 Source: iGrad Author, "The Cost of Replacing an Employee and the Role of Financial Wellness", Enrich, January 2021
Accept Cookies
A cookie is a small text file that a website saves on your computer or mobile device when you visit the site. It enables the website to remember your actions (data inputs, website navigation), so you don’t have to re-enter data when you come back to the site or browse from one page to another.
Behavioral information collected by our web analytics vendor is used to analyze data pertaining to visitor trends, plan website enhancements, and measure overall website effectiveness. We may also use cookies or web beacons to help us offer you products, programs, or services that may be of interest to you and to deliver relevant advertising. We may use third-party advertising companies to help tailor website content to users or to serve ads on our behalf. These companies may also employ cookies and web beacons to measure advertising effectiveness.
Please accept cookies and the collection of behavioral information to receive full functionality and enhance your experience. If you decline cookies, some features of the website may not function normally.
Please see our
Privacy Policy for more information.