JANUARY 2021

The Total Economic Impact™ Of Bizagi’s Low-Code Intelligent Process Automation Platform

Productivity Gains, Cost Savings And Business Benefits Enabled By Bizagi’s Low-Code Intelligent Process Automation Platform

Across industries, automating business processes to win, serve, and retain customers has been an imperative for years. In a recent survey, Forrester found that over 60% of the surveyed organizations are reconsidering their process automation strategy in light of new work patterns or economic circumstances.1 Based on interviews with five Bizagi customers, this case study examines the costs and benefits of deploying an enterprisewide process automation program based on Bizagi’s Low-Code Intelligent Process Automation Platform.

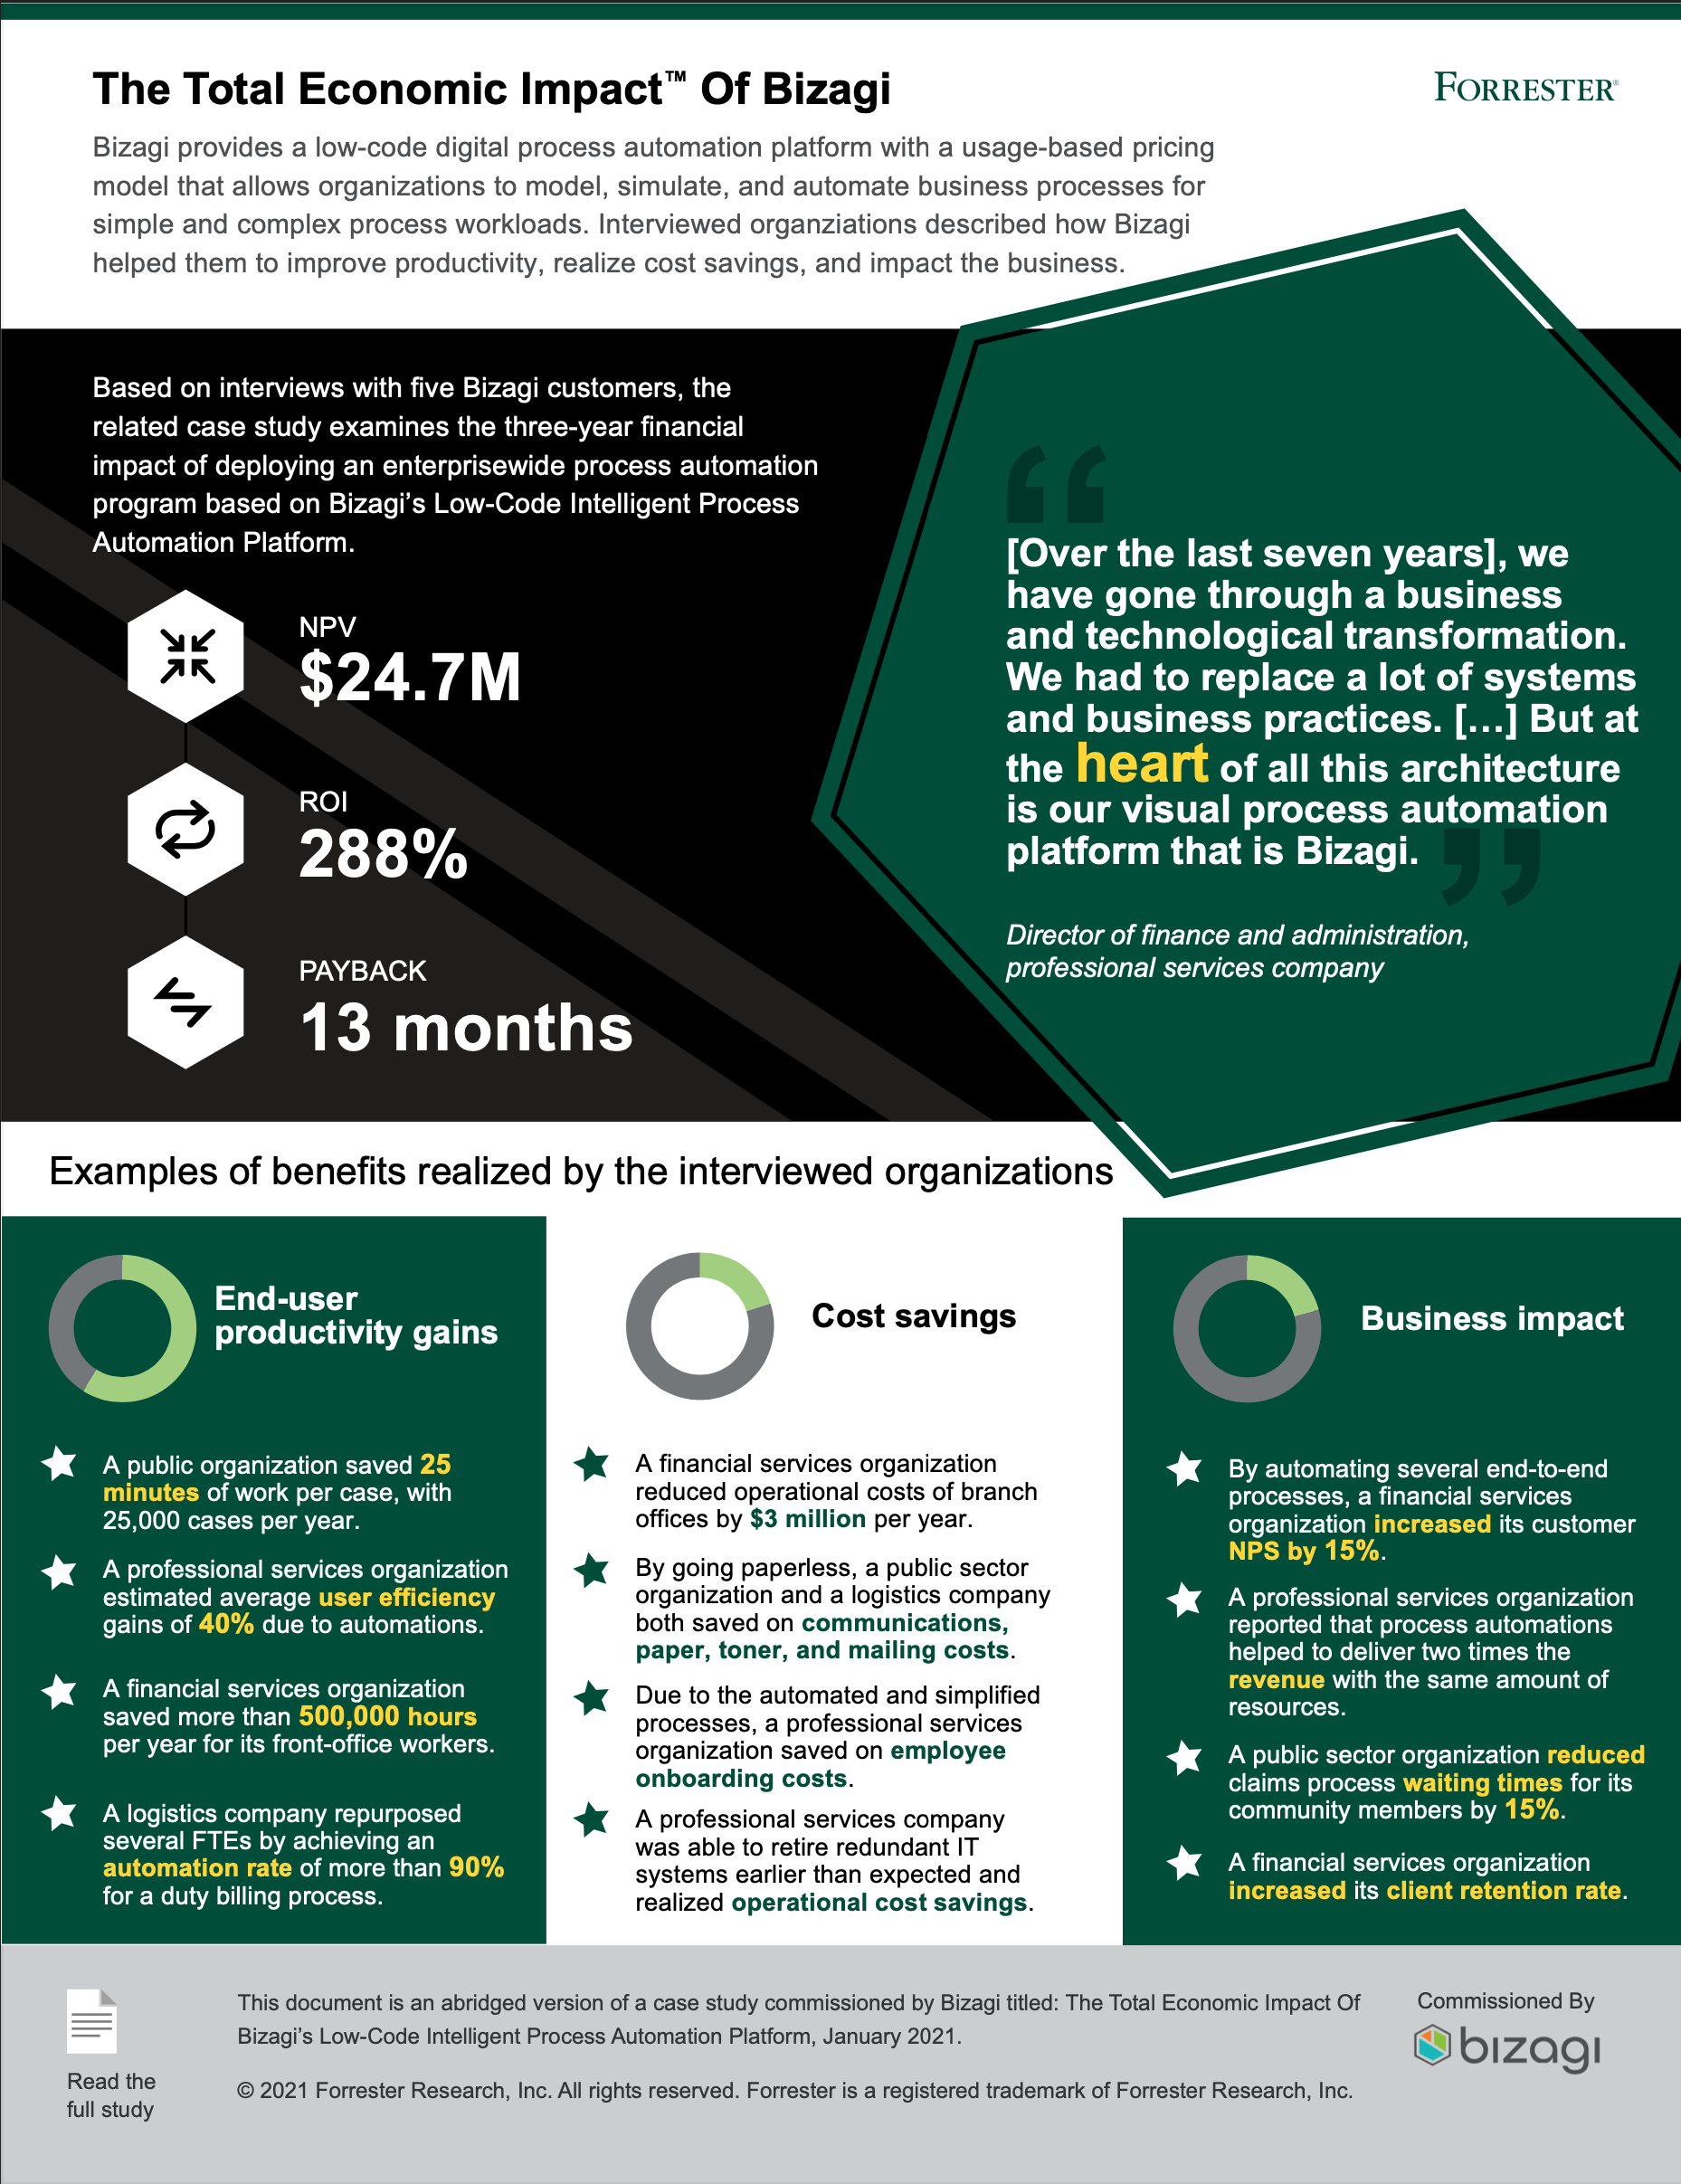
Increasingly, organizations are allocating budgets and efforts to accelerate their digital business transformations, improve customer experience, increase employee productivity, and find ways to reduce costs. Process automation can play a key part in all of these strategic initiatives. However, organizations are often challenged by a general lack of agility, costly manual processes, and technical issues, such as data residing in disjointed systems. They realize the need to find a more holistic approach, and thus, they are looking to new solutions and to new tools in order to both orchestrate these new systems and to enable their business teams to automate processes at scale.

Bizagi provides a low-code digital process automation platform with a usage-based pricing model that allows organizations to model, simulate, and automate business processes for simple and complex process workloads.

Bizagi commissioned Forrester Consulting to conduct a Total Economic Impact™ (TEI) study and examine the potential return on investment (ROI) enterprises may realize by deploying Bizagi’s Intelligent Process Automation Platform.The purpose of this study is to provide readers with a framework to evaluate the potential financial impact of Bizagi’s Low-Code Intelligent Process Automation Platform on their organizations.

“[Over the last seven years], we have gone through a business and technological transformation. We had to replace a lot of systems and business practices. […] But at the heart of all this architecture is our visual process automation platform that is Bizagi."

Director of finance and administration, professional services company

To better understand the benefits, costs, and risks associated with this investment, Forrester interviewed five Bizagi customers with multiple years of experience using Bizagi’s Low-Code Intelligent Process Automation Platform. And, cumulatively, these five customers have realized hundreds of process automations. For the purposes of this study, Forrester aggregated the experiences of the interviewed customers and combined the results into a single composite organization.

Prior to using Bizagi’s platform, these organizations were generally struggling with inefficient and inconsistent processes on the one hand, and a heterogeneous, legacy environment of systems and tools on the other.

With the investment in and the deployment of Bizagi’s platform, these organizations typically started with the automation of some less complex, internal, or back-office workflows. Over time, as they became more familiar with the methodologies and the platform, they started to rethink the front office; and as a result, they were able to simply create more complex automated end-to-end processes.

Consulting Team:
  • Sebastian Selhorst,
  • Edgar Casildo

Project Contributors:

Key Statistics

  • Return on investment (ROI)

    288%

  • Net present value (NPV)

    $24.7M

Key Financial Findings

  • ROI
    288%
  • Benefits PV
    $33.3M
  • NPV
    $24.7M
  • Payback
    13 months

Quantified benefits. The interviewed organizations automated hundreds of business processes over the past few years. These processes range from simple workflows such as an internal absence leave requests to complex end-to-end business processes such as a customer onboarding and mortgage request. Obviously, the benefits that an organization can achieve by automating a given business process are inherently linked to the function this process fulfills and its execution. This being said, the benefits typically fall in one of the following three categories: end-user productivity gains, cost savings, or business impact. Based on the results obtained from the interviewed organizations, this analysis estimates the likely financial impact on the composite organization described in this case study, which is a large financial services organization with approximately $5 billion in annual revenue. Concrete examples of benefits achieved by the interviewed organizations can be found in the Analysis Of Benefits section.

  • End-user productivity gains.

    Each of the interviewed organizations reported productivity gains as one of the major outcomes of their process automations. Processes become simplified and standardized, thereby, process steps are automated — resulting, for example, in an elimination of manual tasks, fewer data entry errors, less inquiries, and reduced audit-related efforts. For the composite organization, the productivity gains have an estimated, risk-adjusted present value (PV) of $19.6 million over the three years of the analysis.

  • Cost savings.

    Interviewees also noted a multitude of ways that allowed them to reduce costs. By going paperless, organizations reduced their communications, paper, and mailing costs; the simplification and standardization of processes resulted in reduced training costs. With this reduction in dependence on IT departments, the interviewed organizations were able to realize development cost savings. And some organizations were even able to retire redundant legacy applications. For the composite organization, the cost savings over three years have an estimated, risk-adjusted PV of $6.5 million.

  • Business impact.

    Generally, the automation of end-to-end business processes also allowed the interviewed organizations to reduce cycle or waiting times for their customers and improve their service delivery. This, for example, resulted in higher customer satisfaction, increased Net Promoter Scores, and improved client retention rates.2 One of the interviewees also reported an increase in the number of cross- and up-sell opportunities. Of course, each organization needs to assess if and how process automations might impact their own business or operations. For the composite organization, Forrester assumes an increase in the company’s revenue, resulting in incremental profit with an estimated, risk-adjusted PV of $7.1 million over three years.

Costs. To achieve the above benefits, the interviewed organizations experienced costs in the following areas. Forrester has estimated these costs according to the scenario of the composite organization described in this case study.

  • Technology costs.

    The technology costs include estimations of Bizagi’s platform and usage fees as well as the underlying infrastructure costs for an on-premises deployment. For the composite organization, these costs have an estimated three-year, risk-adjusted PV of $1.5 million.

  • Initial setup costs.

    The internal labor costs related to the initial deployment and integration of the platform, as well as the preparation of the back-end data architecture have an estimated, risk-adjusted PV of $275,000 for the composite organization.

  • Internal application development and support costs.

    These costs represent the biggest expense category, and they account for the internal efforts spent on the design, development, and deployment of the automated processes, as well as level 1 and level 2 end-user support and overall program governance. For the composite organization, these internal labor costs have an estimated three-year, risk-adjusted PV of $3.8 million.

  • External services costs.

    To jump-start their process automation programs, the interviewed organizations typically invested in external services from either Bizagi or another third party. For this analysis, Forrester assumed that the composite organization invests in service and advisory packages from Bizagi. As the internal knowledge and comfort level with process automations increase over time, the external services are ramped down. For the composite organization, these external service costs have an estimated three-year, risk-adjusted PV of $730,000.

  • End-user training and change management costs.

    Change management and training constitute an important part of any transformational activity. The composite organization sets up a core center of excellence (COE) to lead its various process automation projects. By Year 3, this team reaches a size of 23 full-time equivalents (FTEs). Furthermore, the analysis accounts for end-user training costs for each deployed process. For the composite organization, these internal change management and training costs have an estimated three-year, risk-adjusted PV of $2.2 million.

Based on customer interviews and financial analysis, Forrester has sought to create a fairly typical investment scenario for a composite organization. The composite organization described in this analysis experiences benefits of $33.3M over three years versus costs of $8.6M, adding up to a net present value (NPV) of $24.7M and an ROI of 288%.


TEI Framework And Methodology

From the information provided in the interviews, Forrester constructed a Total Economic Impact™ framework for those organizations considering an investment in Bizagi’s Intelligent Process Automation Platform.

The objective of the framework is to identify the cost, benefit, flexibility, and risk factors that affect the investment decision. Forrester took a multistep approach to evaluate the impact that Bizagi’s Intelligent Process Automation Platform can have on an organization.

  • DUE DILIGENCE

    Interviewed Bizagi stakeholders and Forrester analysts to gather data relative to the Low-Code Intelligent Process Automation Platform.

  • CUSTOMER INTERVIEWS AND SURVEY

    Interviewed five decision-makers at organizations using the Low-Code Intelligent Process Automation Platform to obtain data with respect to costs, benefits, and risks.

  • COMPOSITE ORGANIZATION

    Designed a composite organization based on characteristics of the interviewed organizations.

  • FINANCIAL MODEL FRAMEWORK

    Constructed a financial model representative of the interviews using the TEI methodology and risk-adjusted the financial model based on issues and concerns of the interviewed organizations.

  • CASE STUDY

    Employed four fundamental elements of TEI in modeling the investment impact: benefits, costs, flexibility, and risks. Given the increasing sophistication of ROI analyses related to IT investments, Forrester’s TEI methodology provides a complete picture of the total economic impact of purchase decisions. Please see Appendix A for additional information on the New Tech TEI methodology.

DISCLOSURES

Readers should be aware of the following:

This study is commissioned by Bizagi and delivered by Forrester Consulting. It is not meant to be used as a competitive analysis.

Forrester makes no assumptions as to the potential ROI that other organizations will receive. Forrester strongly advises that readers use their own estimates within the framework provided in the report to determine the appropriateness of an investment in Bizagi’s Low-Code Intelligent Process Automation Platform.

Bizagi reviewed and provided feedback to Forrester, but Forrester maintains editorial control over the study and its findings and does not accept changes to the study that contradict Forrester’s findings or obscure the meaning of the study.

Bizagi provided the customer names for the interviews but did not participate in the interviews.

DRIVERS LEADING TO THE BIZAGI PLATFORM INVESTMENT

Interviewed Organizations

Industry Region Interviewee Number of employees Number of processes automated with Bizagi
Public sector US Enterprise modernization project manager 120 40 to 55 processes ready to be deployed
Professional services EMEA Director of finance and administration 280 54 end-to-end processes
Financial services Latin America VP of service delivery and operations 30,000
  • 22 complex processes
  • 1,600 small processes
Logistics EMEA VP of center of digitization 500,000+ 10 end-to-end processes
Financial services EMEA Head of business architecture 30,000
  • 75 front-end processes
  • 100 small processes

Key Challenges

For this study, Forrester conducted interviews with five Bizagi customers. All of the interviewed organizations had been using the Bizagi platform for several years and automated numerous processes. While they represent different industries and differ in size, they all struggled with common challenges, including:

    • Inefficient and inconsistent processes.

      The interviewed organizations reported that many of their processes were still fairly manual, sometimes still paper-based, and that — more often than not — they were inconsistently used across different groups, departments, or regions. This resulted in general inefficiencies, relatively high turnaround times, and end-user or customer frustrations.

    • Heterogeneous, legacy environment of systems and tools.

      When trying to automate processes, interviewees faced challenges in working with legacy systems and tools that had never really been designed to work together. Some noted that, over time, their organizations’ technology stack became more and more complex. Companies that had experience using other legacy business process management solutions in the past found that those were not able to cope with either more complex or high-volume processes.

“We had a lot of manual and repetitive processes. We decided that adopting a business process management [BPM] tool was the best way to reduce these tasks, and we determined that Bizagi was the best partner for us.”

VP of service delivery and operations, financial services organization


Solution Requirements

The interviewed organizations searched for a low-code digital process automation solution that could:

    • Cover wide application deployments as well as more complex process and case management scenarios.

    • Act like an orchestrator and work together with the legacy systems and tools to protect the investment in existing IT assets.

    • Empower the business users to maintain and evolve their own business processes.


“I was originally a very skeptic evaluator to low-code solutions.[…] But reevaluating the tools, the costs to acquire the tools, creating the team, deploying the system, and maintaining it, Bizagi really won out in that conversation. It’s the best fit for our environments.”

Enterprise modernization project manager, public sector organization

Composite Organization

Based on the interviews, Forrester constructed a TEI framework, a composite company, and a ROI analysis that illustrates the areas financially affected. The composite organization is representative of the five companies that Forrester interviewed and is used to present the aggregate financial analysis in the next section. The composite organization has the following characteristics:

  • Description of composite.

    The composite organization is a global financial services organization with $5 billion in annual revenue and 30,000 employees. It operates in a highly regulated environment. The composite organization started its digital transformation journey and wants to automate end-to-end processes, ranging from simple employee requests to highly sophisticated processes that are in support of direct customer interactions. However, one of the challenges that the company is facing is the disparity of its legacy IT environment. The systems, applications, and tools mostly work in silos and were never designed to work together. Similar to some of the interviewed organizations, the composite organization used a lightweight, legacy business process management (BPM) solution. However, it realized the need for a more modern and robust digital process automation (DPA) tool to be able to automate more complex and high-volume processes.

  • After a thorough evaluation process, the composite organization decided to invest in Bizagi’s platform. The main objectives were to:

    • Increase productivity.
    • Empower business users.
    • Realize cost savings.
    • Automate processes at scale.
  • Deployment characteristics.

    The composite organization chose to deploy Bizagi on-premises and start automating a few simple and medium processes in Year 1. Once it became more familiar with the new environment and ways of working, it gradually adds new processes, including those which are more complex, starting in Year 2. For the sake of this analysis, Forrester assumes that, on average: a simple process runs through 10 steps and only requires some basic integrations; a medium process runs through 25 steps; and a complex process runs through 40 steps and requires more advanced and custom integrations.

    The table below indicates the cumulated number of end-to-end processes that are rolled out by the composite organization over three years. More detailed process assumptions can be found in Appendix B.

Key assumptions:
  • Financial services organization with global operations
  • $5 billion annual revenue
  • 30,000 employees
Cumulated number of processes Year 1 Year 2 Year 3
Simple 12 19 26
Medium 2 11 21
Complex 0 3 6
NEXT SECTION: Analysis Of Benefits

QUANTIFIED BENEFIT AND COST DATA AS APPLIED TO THE COMPOSITE

Total Benefits

Ref Benefit Year 1 Year 2 Year 3 Total Present Value
Atr End-user productivity gains $837,216 $8,064,406 $16,270,130 $25,171,752 $19,649,893
Btr Cost savings $570,000 $2,645,750 $5,071,575 $8,287,325 $6,515,101
Ctr Business impact $0 $2,970,000 $6,237,000 $9,207,000 $7,140,496
Total benefits (risk-adjusted) $1,407,216 $13,680,156 $27,578,705 $42,666,077 $33,305,490

End-User Productivity Gains

  • Evidence and data.

    All of the interviewed organizations reported end-user productivity gains due to their process automation efforts. Processes were standardized and simplified, i.e., manual process steps were eliminated. Interviewees also noted that fewer manual data entries reduced the number of human errors and avoided time spent on escalations, investigations, and error resolutions. In addition, process automation: reduced the reliance on email, spreadsheets, and other systems; offered more process transparency and analytical insights; and made users’ work generally more efficient. One interviewee also stated that process standardizations resulted in improved process compliance and process auditability, which reduced time spent on audits. The following are a few examples of achievements by the interviewed organizations.

    • Due to the automation of a claims process and a reduced need for manual data entries, a public organization saved 25 minutes of work per case, with 25,000 cases per year.
    • A professional services organization estimated average user efficiency gains of 40% due to various business process automations.
    • A financial services organization saved more than 500,000 hours per year for its front-office workers by automating processes with Bizagi.
    • A logistics company repurposed several FTEs by achieving an automation rate of more than 90% for a duty billing process.
    • A financial services organization improved compliance and reduced operational risk by automating repetitive and manual tasks.
    Modeling and assumptions.
  • It goes without saying that each individual business process has its own unique potential of productivity gains, and readers are asked to evaluate the potential time savings for their specific organization. However, for the sake of this analysis, Forrester made some conservative estimates of average savings per process that are in line with the overall productivity gains experienced by the interviewed organizations. For the composite organization, Forrester assumes that:

    • Prior to process redesign and automation, the execution of a simple process included on average three manual steps. Additionally, a medium process required six manual steps and a complex process required 12 manual steps.

    • Due to the process automation, an end user saves on average 7 minutes per avoided manual step in a simple process, 12 minutes per avoided manual step in a medium process, and 40 minutes per avoided manual step in a complex process.

    • The model further assumes that the impact a given process has on the composite organization increases by 10% per year after the initial rollout, due to continuous process improvements and higher adoption and usage rates.

    • The average fully loaded annual salary rate across business users is $80,000 or $38 per hour.

    • To be conservative in our estimations, Forrester assumes that only 50% of the time saved is actually transformed into productive output.

    Risks.
  • To take into account the uncertainty of the average assumptions made, Forrester adjusted this benefit downward by 15%, yielding a three-year, risk-adjusted total PV (discounted at 10%) of $19.6 million.

“By automating [numerous] business processes [with the help of Bizagi], we were able to maintain the same number of back-office and middle-office FTEs while being able to deliver a lot more to our clients, and this with a higher degree of control and quality than we could have done before.”

Director of finance and administration, professional services company

“Right now, we have to manually scan and index [paper documents]. Bizagi is helping us transform this into a digital process, helping us act on this intelligence. This is huge for [our end users].”

Enterprise modernization project manager, public sector organization

End-User Productivity Gains

Ref. Metric Calculation Year 1 Year 2 Year 3
A1 Number of simple processes newly automated in given year Assumption 12 7 7
A2 Assumed average number of minutes saved per avoided manual step in simple process Assumption 7.0 7.0 7.0
A3 Assumed number of previously manual steps in simple process Assumption 3 3 3
A4 Average number of monthly cases per simple process Assumption 400 400 400
A5 Number of hours saved due to new automation of simple processes in given year A1*A2/60*A3*A4*12 20,160 11,760 11,760
A6 Number of medium processes newly automated in given year Assumption 2 9 10
A7 Assumed average number of minutes saved per avoided manual step in medium process Assumption 12 12 12
A8 Assumed number of previously manual steps in medium process Assumption 6 6 6
A9 Average number of monthly cases per medium process Assumption 1,100 1,100 1,100
A10 Number of hours saved due to new automation of medium processes in given year A6*A7/60*A8*A9*12 31,680 142,560 158,400
A11 Number of complex processes newly automated in given year Assumption 0 3 3
A12 Assumed average number of minutes saved per avoided manual step in sophisticated process Assumption 40 40 40
A13 Assumed number of previously manual steps in sophisticated process Assumption 12 12 12
A14 Average number of monthly cases per sophisticated process Assumption 1,000 1,000 1,000
A15 Number of hours saved due to new automation of complex processes in given year A11*A12/60*A13*A14*12 0 288,000 288,000
A16 Average hourly salary rate (business user) Assumption $38 $38 $38
A17 Productivity capture Assumption 50% 50% 50%
A18 End-user productivity gains due to new automations in a given year (A5+A10+A15)*A16*A17 $984,960 $8,404,080 $8,705,040
A19 Assumed annual increase in impact Assumption 10% 10% 10%
At End-user productivity gains Year 1: A18(Y1)
Year 2: A18(Y2)+A18(Y1)*(1+A19)
Year 3: A18(Y3)+A18(Y2)*(1+A19)+ A18(Y1)*(1+A19)^2

$984,960

$9,487,536
$19,141,330
Risk adjustment ↓15%
Atr End-user productivity gains (risk-adjusted) $837,216 $8,064,406 $16,270,130
Three-year total: $25,171,752 Three-year present value: $19,649,893

Cost Savings

    Evidence and data.
  • Cost savings also belong to the common objectives regularly cited by organizations for automating business processes, and the interviewees reported multiple ways how their organizations realized economies. Going paperless, for instance, did not only speed up processes but it also generated tangible communications and paper-related cost savings. Several interviewees reported how Bizagi’s low-code platform reduced the dependence on the IT department and resulted in IT development cost savings. It also allowed businesspeople to drive critical automation with far fewer IT resources. The simplification and standardization of processes drove process consistency, resulting in shorter employee onboarding times and training cost savings. One interviewee noted that increased process transparency and visibility resulted in audit cost savings. Furthermore, due to the introduction of Bizagi’s platform that integrates with other legacy IT systems, organizations were either able to retire redundant tools and applications or extend the life cycle of their legacy IT assets and thus realize cost savings.

    The following are a few cost savings examples realized by the interviewed organizations.

    • A financial services organization reduced operational costs of branch offices by $3 million per year due to the ability to deploy more junior agents and reduced training costs.

    • By going paperless, a public sector organization and a logistics company both saved on communications, paper, toner, and mailing costs.

    • Due to the automated and simplified processes, a professional services organization saved on employee onboarding costs by reducing onboarding time by 20%.

    • Due to the seamless integration between Bizagi and legacy systems, a logistics company protected its investment in these legacy IT assets and avoided early replacement costs.

    • A professional services company was able to retire redundant IT systems earlier than expected and realized operational cost savings.

  • Modeling and assumptions.

    There are many areas where organizations might save costs by automating business processes, and each individual process will have its own potential of savings. While readers should of course determine potential cost savings for their own organization, Forrester made some conservative estimates of average cost savings per automated process for the composite organization that are in line with the overall savings experienced by the interviewed organizations. For the composite organization, Forrester assumes that:

    • On average, a simple process will generate $25,000 in annual savings (corresponding to approximately $5.20 per executed case), a medium process will generate $150,000 in annual savings (corresponding to approximately $11.40 per executed case), and a complex process will generate $200,000 in annual savings.

    • The model further assumes that the cost savings related to a given process will increase by 10% per year after initial rollout, due to continuous process improvements and higher adoption and usage rates.

    Risks.
  • To take into account the uncertainty of the average assumptions made, Forrester adjusted this benefit downward by 5%, yielding a three-year, risk-adjusted total PV of $6.5 million.

“One of the characteristics of Bizagi is that it is very easy to use. For many of our flows, our operational team can just take care of them and actually draw and design them in Bizagi. This empowers our team and reduces our reliance on IT”.

VP of service delivery and operations, financial services organization

“Everyone from our CEO to our supply manager are involved in some way in the design, test, [and] certification of processes. We have support from the entire organization. It is really an amazing environment. In 30 years of project management, it is the first time I have ever seen that kind of buy-in across the board.”

Enterprise modernization project manager, public sector organization

Cost Savings

Ref. Metric Calculation Year 1 Year 2 Year 3
B1 Number of simple processes newly automated in given year A1 12 7 7
B2 Assumed average cost savings per simple process Assumption $25,000 $25,000 $25,000
B3 Number of medium processes newly automated in given year A6 2 9 10
B4 Assumed average cost savings per medium process Assumption $150,000 $150,000 $150,000
B5 Number of complex processes newly automated in given year A11 0 3 3
B6 Assumed average cost savings per complex process Assumption $200,000 $200,000 $200,000
B7 Incremental cost savings due to newly automated processes in a given year (B1*B2)+(B3*B4)+(B5*B6) $600,000 $2,125,000 $2,275,000
B8 Assumed annual increase in impact A19 10% 10% 10%
Bt Cost savings Year 1: B7(Y1)
Year 2: B7(Y2)+B7(Y1)*(1+B8)
Year 3: B7(Y3)+B7(Y2)*(1+B8)+ B7(Y1)*(1+B8)^2
$600,000 $2,785,000 $5,338,500
Risk adjustment ↓5%
Btr Cost savings (risk-adjusted) $570,000 $2,645,750 $5,071,575
Three-year total: $8,287,325 Three-year present value: $6,515,101

Business Impact

    Evidence and data.
  • Interviewees did not only report internal productivity gains and hard cost savings, but they also described how the automation of end-to-end business processes — which were often in support of direct customer interactions — impacted their businesses. They noted that consistent, simplified, and streamlined processes enabled their organization to deliver better services to their customers or communities. Often cycle and waiting times were reduced, which also contributed to higher customer satisfaction and retention rates, which, in turn, had a positive impact on the company’s revenues. One interviewee also reported that the automation and simplification of its front-office processes contributed to the generation of more up-sell and cross-sell opportunities. The following are a few examples of business benefits realized by the interviewed organizations.

    • A professional services organization reported that process automations helped to deliver two times the revenue with the same amount of resources.

    • A financial services organization generated incremental cross- and up-sell opportunities in branch offices due to achievement of a single customer view and simplified processes. The organization managed to transform branch offices from cost centers into profit centers.

    • By automating workers’ compensation benefit claims processes, a public sector organization reduced waiting times for its community members by 15%.

    • Due to its efforts in redesigning and automating end-to-end business processes, a financial services organization increased its client retention rate.

    • By automating and simplifying the mortgage process, a financial services organization increased the number of mortgage transactions and its related revenues.

    Modeling and assumptions.
  • As seen from the examples above, there are many ways how the automation of an end-to-end business process can improve the customer experience and have a direct or an indirect impact on the composite organization’s revenue. Of course, not every complex process will necessarily lead to incremental revenue, however, a few might — especially those which support direct customer interactions. For most of the interviewees, their process automation efforts supported their company’s business growth. So, for the sake of this analysis, and based on the achievements of the interviewed organizations, Forrester assumes that the composite organization’s process automation program yields some pockets of incremental revenue gains. For simplicity, the amount is spread out as an average across all complex processes; simple and medium processes are not considered. Readers should determine the potential for incremental revenues for each of their own processes. For the composite organization, Forrester assumes that:

    • Complex processes start being deployed in Year 2 of the analysis.

    • On average, the automation of a complex process contributes to the composite organization’s top line by adding 0.2% of its annual revenue.

    • The composite organization, which represents a large financial services organization, has an operating margin of 11%. Note that, for estimating a return on investment, Forrester only considers the incremental profit and not the total incremental revenue.

    • The model further assumes that the business impact related to a given complex process increases by 10% per year after initial rollout, due to continuous process improvements and higher adoption and usage rates.

    Risks.
  • To take into account the uncertainty of the average assumptions made, Forrester adjusted this benefit downward by 10%, yielding a three-year, risk-adjusted total PV of $7.1 million.

By automating several end-to-end processes, a financial services organization increased its customer NPS by: 15%.

“[Bizagi and the whole ecosystem] have also allowed us to jump-start our digital sales strategy. So, now, customers don’t need to go into our branches, they can easily go to our online portal and apply online for a number of our products. We now generate more than 80,000 transactions per year this way.”

VP of service delivery and operations, Financial services organization

Business Impact

Ref. Metric Calculation Year 1 Year 2 Year 3
C1 Cumulated number of automated complex processes Assumption 0 3 6
C2 Annual revenue of the organization Assumption $5,000,000,000 $5,000,000,000 $5,000,000,000
C3 Average incremental revenue contribution per complex process (as % of total revenue) Assumption 0.20% 0.20% 0.20%
C4 Average profit margin Assumption 11% 11% 11%
C5 Assumed annual increase in impact Assumption 0% 10% 10%
C6 Incremental profit due to automation of complex processes C1*C2*C3*C4+(C6(Y-1)*C5) $0 $3,300,000 $6,930,000
Ct Business impact C6 $0 $3,300,000 $6,930,000
Risk adjustment ↓10%
Ctr Business impact (risk-adjusted) $0 $2,970,000 $6,237,000
Three-year total: $9,207,000 Three-year present value: $7,140,496

Flexibility

The value of flexibility is unique to each customer. There are multiple scenarios in which a customer might implement a digital business process automation platform and later realize additional uses and business opportunities, including:

  • Increased business agility.

    Automated processes are far more resilient and agile in the face of unexpected circumstances such as the COVID-19 crisis and the subsequent reaction to competitive business threats or opportunities. Having gone through an enterprisewide process automation journey, organizations will have learned new lessons in software design, development, and delivery. These new skills, processes, and technologies will help organizations achieve strategic goals and increase the agility of their business.

  • Improved online capabilities.

    Interviewed organizations reported how they intend to use their automated processes as a catalyst for building or extending the digital sales channel.

Flexibility would also be quantified when evaluated as part of a specific project (described in more detail in Appendix A).

“I truly believe that whatever changes in the context of our business, we will now be able to adopt quickly to it because of the flexibility that Bizagi brings us.”

Director of finance and administration, professional services company

NEXT SECTION: Analysis Of Costs

Total Costs

Ref. Cost Initial Year 1 Year 2 Year 3 Total Present Value
Dtr Technology costs $44,100 $226,800 $775,950 $862,050 $1,908,900 $1,539,234
Etr Initial setup costs $275,000 $0 $0 $0 $275,000 $275,000
Ftr Technology costs $44,100 $226,800 $775,950 $862,050 $1,908,900 $1,539,234
Gtr External services costs $0 $244,650 $542,850 $73,500 $861,000 $726,267
Htr Training and change management costs $19,008 $334,400 $1,181,444 $1,235,916 $2,770,768 $2,227,970
Total costs (risk-adjusted) $338,108 $1,559,792 $4,331,070 $882,000 $2,815,400 $2,349,603

Technology Costs

The composite organization chose to deploy the Bizagi platform on-premises. Based on the scenario of the composite organization, these costs provide a high-level estimation of the technology-related expenses, including the costs related to the Bizagi platform and the IT infrastructure-related capital (capex) and operating (opex) expenditures.

  • Modeling and assumptions.

    For the composite analysis, Forrester included estimations of the following technology costs:

    • Bizagi’s platform and usage fees, including production and test environments and the Bizagi modeler services, which gives access to a cloud portal to simulate, collaborate, and publish workflow diagrams.

    • Bizagi’s premium support (Silver in Year 1 and Gold in Years 2 and 3).

    • IT infrastructure costs for the on-premises deployment, including hardware, operating systems, network, storage, hosting and maintenance costs. By Year 3 of the analysis, a total of 14 virtual servers support the production, disaster recovery, and test environments.

  • Risks.

    To take into account the uncertainty of the average assumptions made, Forrester adjusted this cost upward by 5%, yielding a three-year, risk-adjusted total PV (discounted at 10%) of approximately $1.5 million.

Technology Costs

Ref. Metric Calculation Initial Year 1 Year 2 Year 3
D1 Estimated Bizagi platform and usage fees Assumption $114,000 $618,000 $700,000
D2 Estimated Bizagi support costs Assumption $38,000 $57,000 $57,000
D3 Estimated IT infrastructure costs Assumption $42,000 $64,000 $64,000 $64,000
Dt Technology costs D1+D2+D3 $42,000 $216,000 $739,000 $821,000
Risk adjustment ↑5%
Dtr Technology costs (risk-adjusted) $44,100 $226,800 $775,950 $862,050
Three-year total: $1,908,900 Three-year present value: $1,539,234

Initial Setup Costs

With the initial deployment and integration of the platform, interviewed organizations also noted that they had to spend time and efforts in preparing the back-end environment, e.g., redefining the underlying data architecture.

  • Modeling and assumptions.

    For the composite analysis, Forrester made the following assumption:

    • The equivalent of 10 FTEs work for three months on the initial setup and integration of the platform, as well as on the preparation of the back-end environment, e.g., redefining the underlying data architecture.

  • Risks.

    To take into account the uncertainty of the average assumptions made, Forrester adjusted this cost upward by 10%, yielding a three-year, risk-adjusted total PV (discounted at 10%) of approximately $275,000.

Initial Setup Costs

Ref. Metric Calculation Initial Year 1 Year 2 Year 3
E1 Number of FTEs involved in back-end preparation, platform installation and integrations Assumption 10
E2 Number of months for initial setup including back-end preparations Assumption 3
E3 Average annual salary rate Assumption $100,000
Et Initial setup costs E1*E2*E3/12 $250,000
Risk adjustment ↑10%
Etr Initial setup costs (risk-adjusted) $275,000 $0 $0 $0
Three-year total: $275,000 Three-year present value: $275,000

Internal Application Development And Support Costs

The internal labor costs, with regards to executing on the whole process automation program, represent the biggest cost category in this analysis, i.e., 45% of the total costs. It involves many resources from the business and IT teams working together on redesigning, developing, deploying, and supporting the different processes. This analysis also assumes that internal staff are responsible for delivering level 1 and level 2 support to the end users.

  • Modeling and assumptions.

    For the composite analysis, Forrester assumes that:

    • The average, initial efforts to design, develop, and deploy a process are estimated as follows: a simple process takes 20 days for an equivalent of three FTEs, a medium process takes 25 days involving four FTEs, and a complex process takes 60 days involving 10 FTEs.

    • Annual efforts for continuous process improvements and application maintenance are estimated to be 10% of the initial process costs.

    • Three FTEs are dedicated to level 2 support and overall governance.

    • The average fully loaded salary of employees involved in the above efforts is $100,000.

    • Level 1 support is delivered by staff inside the respective business units with an average fully loaded salary of $80,000.

  • Risks.

    To take into account the uncertainty of the average assumptions made, Forrester adjusted this cost upward by 5%, yielding a three-year, risk-adjusted total PV of $3.8 million.

Internal Application Development And Support Costs

Ref. Metric Calculation Initial Year 1 Year 2 Year 3
F1 Number of simple processes newly automated in given year Assumption 12 7 7
F2 Number of medium processes newly automated in given year Assumption 2 9 10
F3 Number of complex processes newly automated in given year Assumption 0 3 3
F4 Estimated initial development cost (F1*XX8)+(F2*XX20)+(F3*XX32)
[See Appendix B for XX reference table]
$354,200 $1,201,200 $1,239,700
F5 Estimated ongoing app development and maintenance costs 10%*F4(sum of previous years) $35,420 $155,540
F6 Assumed volume of cases per year (F1(cumulated)*XX4+ F2(cumulated)*XX16+ F3(cumulated)*XX28)*12 84,000 272,400 474,000
F7 Assumed hours of level 1 support required Assumption: 1 hour*2%*F6 1,680 5,448 9,480
F8 Average hourly salary rate (business user) Assumption $38 $38 $38
F9 Estimated level 1 support costs F7*F8 $63,840 $207,024 $360,240
F10 Estimated number of level 2 support/governance staff (in FTE) Assumption 3.0 3.0 3.0
F11 Average fully loaded annual salary rate Assumption $100,000 $100,000 $100,000
F12 Estimated level 2 support and governance costs F10*F11 $300,000 $300,000 $300,000
Ft Internal application development and support costs F4+F5+F9+F12 $0 $718,040 $1,743,644 $2,055,480
Risk adjustment ↑5%
Etr Internal application development and support costs (risk-adjusted) $0 $753,942 $1,830,826 $2,158,254
Three-year total: $4,743,022 Three-year present value: $3,820,009

External Services Costs

Typically, the interviewed organizations used external professional services from either Bizagi or a partner; some just to get started with the first couple of process automations, others for a longer period of time.

  • Modeling and assumptions.

    For the composite analysis, Forrester included the following Bizagi services packages:

    • A Quick Start service package in Year 1.

    • A Transformation Package (SME) in Years 1 and 2.

    • A Center of Excellence Services Package in Year 2.

    • A Technical Advisory Package in Years 2 and 3.

  • Risks.

    To take into account the uncertainty of the average assumptions made, Forrester adjusted this cost upward by 5%, yielding a three-year, risk-adjusted total PV of $730,000.

External Services Costs

Ref. Metric Calculation Initial Year 1 Year 2 Year 3
G1 Estimated Bizagi services costs Assumption $233,000 $517,000 $70,000
Gt External services costs G1 $0 $233,000 $517,000 $70,000
Risk adjustment ↑5%
Gtr External services costs (risk-adjusted) $0 $244,650 $542,850 $73,500
Three-year total: $861,000 Three-year present value: $726,267

Internal Training And Change Management Costs

An important cost component to consider when engaging in process automations is training and change management.

  • Modeling and assumptions.

    For the composite analysis, Forrester assumes that:

    • A core team is formed as a COE and each member receives three weeks of training. The team ramps up from an initial three FTEs to 23 FTEs by the end of Year 3.

    • End users are trained for each process being deployed: 0.5 hours per end user of a simple process, 1 hour per person per medium process, and 8 hours per end user per complex process.

  • Risks.

    To take into account the uncertainty of the average assumptions made, Forrester adjusted this cost upward by 10%, yielding a three-year, risk-adjusted total PV of $2.2 million.

Internal Training And Change Management Costs

Ref. Metric Calculation Initial Year 1 Year 2 Year 3
H1 Number of FTEs added to core team (COE) Assumption 3 9 11
H2 Cumulated number of FTEs in core team (COE) H1 cumulated 3 12 23
H3 Average number of hours of training (initial) Assumption 120 120 120
H4 Average hourly salary rate (core team) Assumption $48 $48 $48
H5 Training of core team H1*H3*H4 $17,280 $51,840 $63,360
H6 Number of simple processes newly automated in given year F1 12 7 7
H7 Number of medium processes newly automated in given year F2 2 9 10
H8 Number of sophisticated processes newly automated in given year F3 0 3 3
H9 Estimated end-user training and change management costs (H6*XX12)+(H7*XX24)+(H8*XX36)
[Appendix B]
$304,000 $1,022,200 $1,060,200
Ht Internal training and change management costs H5+H9 $17,280 $304,000 $1,074,040 $1,123,560
Risk adjustment ↑10%
Htr Internal training and change management costs (risk-adjusted) $19,008 $334,400 $1,181,444 $1,235,916
Three-year total: $2,770,768 Three-year present value: $2,227,970
NEXT SECTION: Financial Summary

CONSOLIDATED THREE-YEAR RISK-ADJUSTED METRICS
  • These risk-adjusted ROI, NPV, and payback period values are determined by applying risk-adjustment factors to the unadjusted results in each Benefit and Cost section.

Cash Flow Chart (Risk-Adjusted)

Cash Flow Table (Risk-Adjusted Estimates)

Initial Year 1 Year 2 Year 3 Total Present Value
Total costs ($338,108) ($1,559,792) ($4,331,070) ($4,329,720) ($10,558,690) ($8,588,480)
Total benefits $0 $1,407,216 $13,680,156 $27,578,705 $42,666,077 $33,305,490
Net benefits ($338,108) ($152,576) $9,349,085 $23,248,985 $32,107,387 $24,717,010
ROI 288%
Payback period 13 months
NEXT SECTION: Appendix

Appendix A: Total Economic Impact

Total Economic Impact is a methodology developed by Forrester Research that enhances a company’s technology decision-making processes and assists vendors in communicating the value proposition of their products and services to clients. The TEI methodology helps companies demonstrate, justify, and realize the tangible value of IT initiatives to both senior management and other key business stakeholders.

Total Economic Impact Approach

  • Benefits represent the value delivered to the business by the product. The TEI methodology places equal weight on the measure of benefits and the measure of costs, allowing for a full examination of the effect of the technology on the entire organization.

  • Costs consider all expenses necessary to deliver the proposed value, or benefits, of the product. The cost category within TEI captures incremental costs over the existing environment for ongoing costs associated with the solution.

  • Flexibility represents the strategic value that can be obtained for some future additional investment building on top of the initial investment already made. Having the ability to capture that benefit has a PV that can be estimated.

  • Risks measure the uncertainty of benefit and cost estimates given: 1) the likelihood that estimates will meet original projections and 2) the likelihood that estimates will be tracked over time. TEI risk factors are based on “triangular distribution.”

  • PRESENT VALUE (PV)

    The present or current value of (discounted) cost and benefit estimates given at an interest rate (the discount rate). The PV of costs and benefits feed into the total NPV of cash flows.

  • NET PRESENT VALUE (NPV)

    The present or current value of (discounted) future net cash flows given an interest rate (the discount rate). A positive project NPV normally indicates that the investment should be made, unless other projects have higher NPVs.

  • RETURN ON INVESTMENT (ROI)

    A project’s expected return in percentage terms. ROI is calculated by dividing net benefits (benefits less costs) by costs.

  • DISCOUNT RATE

    The interest rate used in cash flow analysis to take into account the time value of money. Organizations typically use discount rates between 8% and 16%.

  • PAYBACK PERIOD

    The breakeven point for an investment. This is the point in time at which net benefits (benefits minus costs) equal initial investment or cost.


Appendix B: General Process Assumptions For The Composite Organization

General Process Assumptions For The Composite Organization

Ref. Metric Calculation Initial Year 1 Year 2 Year 3
Simple process
XX1 Cumulated number of simple processes automated 12 19 26
XX2 Average number of executed steps per simple process 10
XX3 Average number of manual process steps (before automation) 3
XX4 Average number of cases per month 400
XX5 Average number of FTEs involved in initial process design and development 3
XX6 Average number of days to develop initial version 20
XX7 Average fully loaded daily salary rate (core team) $100,000/260 days $385
XX8 Initial development costs XX5*XX6*XX7 $23,100
XX9 Average number of process/application users 1,000
XX10 Average number of initial training hours per end user 0.5
XX11 Average fully loaded hourly salary rate (end user) $80,000/2,080 hours $38
XX12 Initial end-user training and change management costs XX9*XX10*XX11 $19,000
Medium process
XX13 Cumulated number of medium processes automated 2 11 21
XX14 Average number of executed steps per medium process 25
XX15 Average number of manual process steps (before automation) 6
XX16 Average number of cases per month 1,100
XX17 Average number of FTEs involved in initial process design and development 4
XX18 Average number of days to develop initial version 25
XX19 Average fully loaded daily salary rate (core team) $100,000/260 days $385
XX20 Initial development costs XX17*XX18*XX19 $38,500
XX21 Average number of process/application users 1,000
XX22 Average number of initial training hours per end user 1
XX23 Average fully loaded hourly salary rate (end user) $80,000/2,080 hours $38
XX24 Initial end-user training and change management costs XX21*XX22*XX23 $38,000
Complex process
XX25 Cumulated number of medium processes automated 0 3 6
XX26 Average number of executed steps per medium process 40
XX27 Average number of manual process steps (before automation) 12
XX28 Average number of cases per month 1,000
XX29 Average number of FTEs involved in initial process design and development 10
XX30 Average number of days to develop initial version 60
XX31 Average fully loaded daily salary rate (core team) $100,000/260 days $385
XX32 Initial development costs XX29*XX30*XX31 $231,000
XX33 Average number of process/application users 600
XX34 Average number of initial training hours per end user 8
XX35 Average fully loaded hourly salary rate (end user) $80,000/2,080 hours $38
XX36 Initial end-user training and change management costs XX33*XX34*XX35 $182,400

Appendix C: Supplemental Material

Related Forrester Research

“Create A Governance Strategy To Meet The Process Imperative,” Forrester Research, Inc., May 21, 2020

“COVID-19 Remote Work Just Broke Your Processes: Here's What To Do About It,” Forrester Research, Inc., April 23, 2020

“The Forrester Tech Tide™: Intelligent Automation, Q1 2020,” Forrester Research, Inc., January 8, 2020

“Now Tech: Digital Process Automation For Deep Workloads, Q3 2019,” Forrester Research, Inc., September 3, 2019

“RPA, DPA, BPM, And DCM Platforms: The Differences You Need To Know,” Forrester Research, Inc., March 1, 2019

“Refocus Process Automation To Rescue Your Digital Transformation,” Forrester Research, Inc., May 17, 2018

“The Growing Importance Of Process To Digital Transformation,” Forrester Research, Inc., May 8, 2018


Appendix D: Endnotes

1 Source: “The Changing Landscape Of IT Incident And Crisis Management,” Forrester Research, Inc., February 20, 2018.

2 Net Promoter and NPS are registered service marks, and Net Promoter Score is a service mark, of Bain & Company, Inc., Satmetrix Systems, Inc., and Fred Reichheld.

Cumulative Net Benefits