JULY 2018

A Forrester Emerging Technology Projection: Total Economic Impact™ Study Commissioned By IBM

Emerging Technology Projection: The Total Economic Impact™ Of IBM Blockchain

Projected Cost Savings And Business Benefits Enabled By IBM Blockchain

Executive Summary

IBM commissioned Forrester Consulting to conduct an Emerging Technology Projection: Total Economic ImpactTM (TEI) study and examine the potential return on investment (ROI) enterprises may realize by deploying an IBM Blockchain Platform and Services solution. The purpose of this study is to provide readers with a framework to evaluate the potential financial impact of IBM Blockchain Platform and Services on their organizations.

Blockchain is an emerging technology, and blockchain-based networks offer the opportunity to develop new business and trust models; that’s why the phrase “revolutionary potential” for once isn’t out of place. Its ability to support multiparty collaboration around shared, trusted data and process automation across organizational boundaries brings benefits at many levels, starting with efficiency gains and culminating in reinventing how entire industry ecosystems operate.

IBM provides a blockchain platform, blockchain services, and ecosystem support for organizations that are looking to develop and deploy their own blockchain solutions. To better understand the benefits, costs, and risks associated with this investment, Forrester interviewed six customers with experience using IBM’s Blockchain.

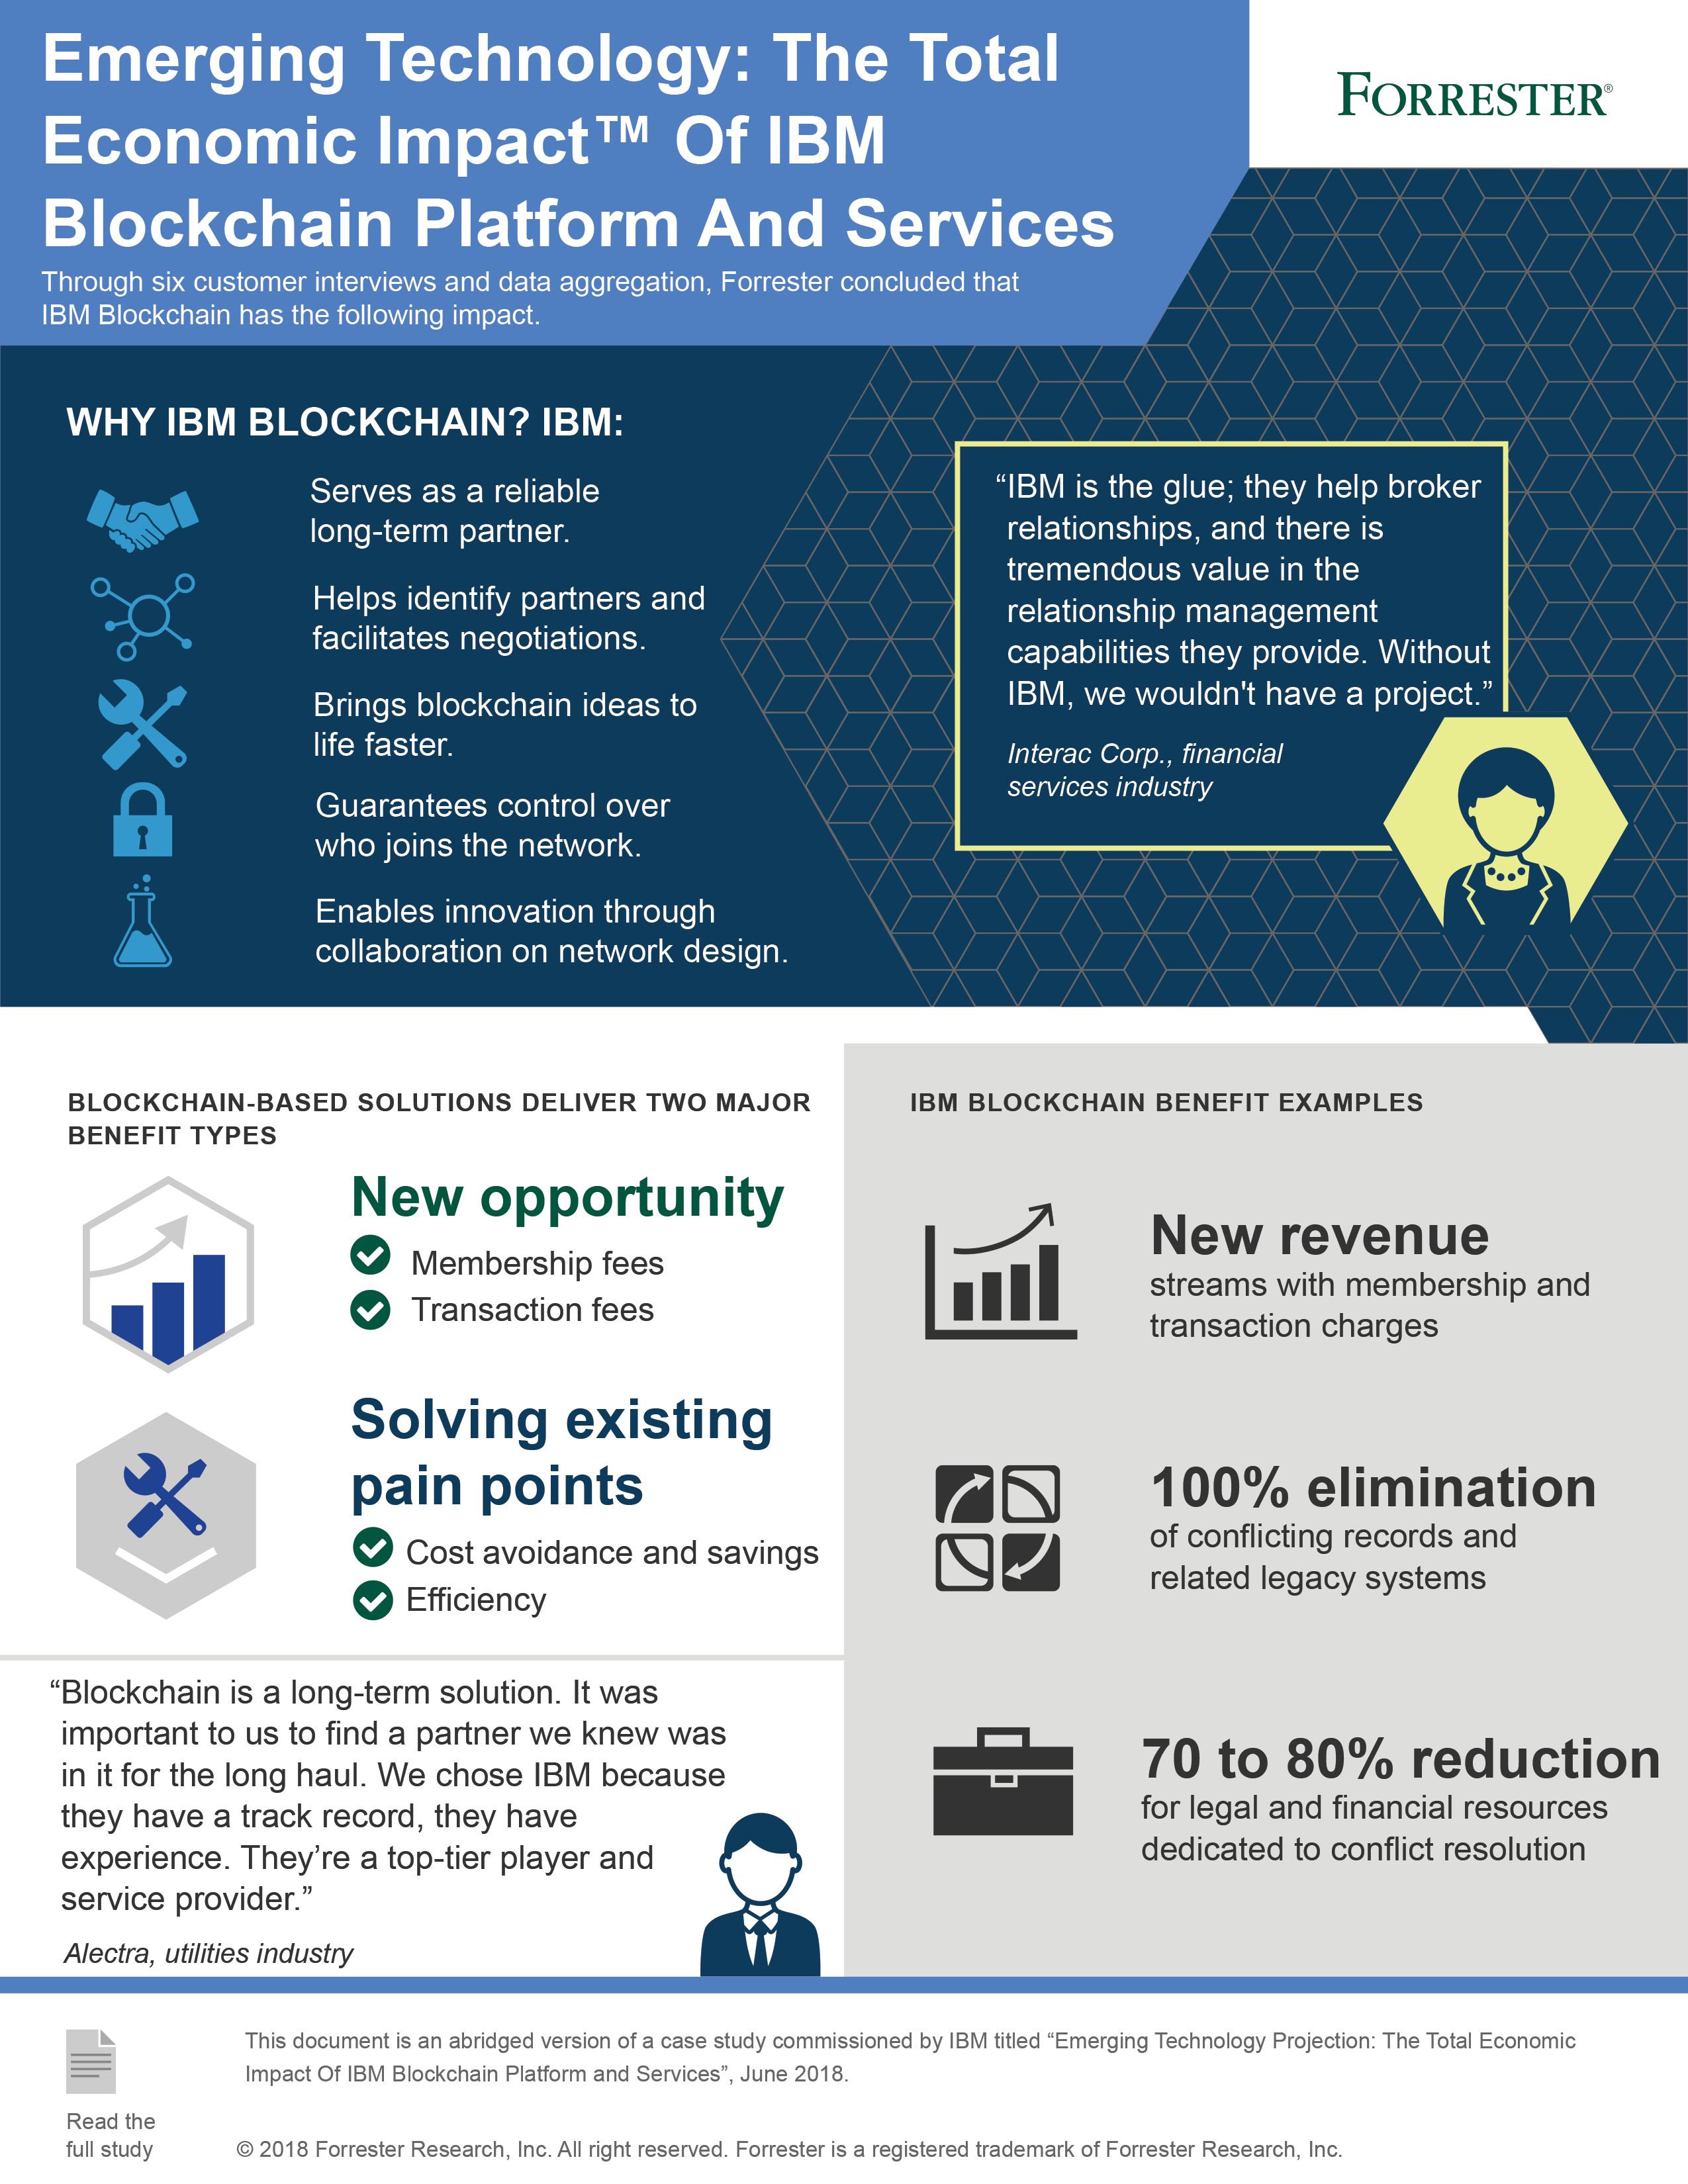
Organizations chose IBM as their partner for developing and deploying a blockchain solution for several reasons: IBM is seen as a reliable, long- term blockchain partner with a proven track record, large customer base, and relevant business and industry experience; IBM has deep technical expertise in blockchain technology to help bring blockchain ideas to life; IBM provides governance model expertise; the permissioned blockchain technology guarantees control over who joins the network and how they access information; and IBM’s collaboration on identifying and solving network problems enables progress in developing a blockchain solution.

There are two aspects that make the TEI analysis of IBM’s Blockchain solution unique:

  1. Interviewed organizations are implementing a wide range of applications and use cases using IBM Blockchain.
  2. Interviewed organizations for this case study have yet to deploy their full solution using IBM Blockchain Platform and Services.

As such, an emerging technology TEI methodology and framework is applied for this case study and analysis. Benefit and cost modules are abstracted from the interviewed organizations’ specific use-case deployments and generalized to a wider range of applications. What this means is that the reader should evaluate which benefit and cost modules are applicable for a specific blockchain application, and then calculate the associated financial analysis using the framework provided in the next sections.

At a high level, the benefit modules can be categorized as either creating new opportunities (green) or solving existing pain points (blue). It is possible that organizations could experience more than one of the identified benefits for a given blockchain solution. Costs are categorized as operation phase.

In addition to the identifying and quantifying example calculations in the benefit modules, an overall sample calculation combining two benefit modules, with the appropriate costs, is also provided as an example of how this analysis framework could be applied to your organization.

IBM Blockchain Benefits

New revenue streams

with membership and transaction charges

100% elimination

of conflicting records and related legacy systems

70-80% reduction

for legal and financial resources dedicated to conflict resolution

Emerging Technology Projection: TEI Framework And Methodology

The TEI methodology helps companies demonstrate, justify, and realize the tangible value of IT initiatives to both senior management and other key business stakeholders.

From the information provided in the interviews, Forrester has constructed an Emerging Technology Projection: Total Economic ImpactTM (TEI) framework for those organizations considering implementing IBM Blockchain Platform and Services.

The objective of the framework is to identify the cost, benefit, flexibility, and risk factors that affect the investment decision. Forrester took a multistep approach to evaluate the impact that IBM Blockchain can have on an organization:

  • DUE DILIGENCE

    Interviewed IBM stakeholders and Forrester analysts to gather data relative to IBM Blockchain Platform and Services.

  • CUSTOMER INTERVIEWS

    Interviewed six organizations using IBM Blockchain Platform and Services to obtain data with respect to costs, projected benefits, and risks.

  • FINANCIAL MODEL FRAMEWORK

    Constructed a financial model representative of the interviews using the TEI methodology and risk-adjusted the financial model based on issues and concerns of the interviewed organizations.

  • SAMPLE CALCULATION

    Developed an analysis based on a sample organization to illustrate how to use the financial model to calculate the ROI of your blockchain solution.

  • CASE STUDY

    Employed four fundamental elements of TEI in modeling IBM Blockchain Platform and Services’ impact: benefits, costs, flexibility, and risks. Given the increasing sophistication that enterprises have regarding ROI analyses related to IT investments, Forrester’s Emerging Technology TEI methodology serves to provide a framework for developing projections of the total economic impact of purchase decisions. Please see Appendix B for additional information on the Emerging Technology TEI methodology.

DISCLOSURES

Readers should be aware of the following:

This study is commissioned by IBM and delivered by Forrester Consulting. It is not meant to be used as a competitive analysis.

Forrester makes no assumptions as to the potential ROI that other organizations will receive. Forrester strongly advises that readers use their own estimates within the framework provided in the report to determine the appropriateness of an investment in IBM Blockchain Platform and Services.

IBM reviewed and provided feedback to Forrester, but Forrester maintains editorial control over the study and its findings and does not accept changes to the study that contradict Forrester’s findings or obscure the meaning of the study.

IBM provided the customer names for the interviews but did not participate in the interviews.


Blockchain Technology And Market Overview

Blockchain-based networks offer the opportunity to develop new business and trust models; that’s why the phrase “revolutionary potential” for once isn’t out of place. Their ability to support multiparty collaboration around shared, trusted data and process automation across organizational boundaries brings benefits at many levels, starting with efficiency gains and culminating in reinventing how entire industry ecosystems operate. Blockchain initiatives fall into two main categories:

  • New business and service models.

    Most of these haven’t been invented yet, but we can see emerging enterprise blockchain networks which open up new markets (e.g., affordable trade finance for smaller businesses), or allow us to rethink the way in which individuals, public authorities, and business interact without compromising data privacy and commercial confidentiality, while also minimizing fraud risk.

  • Improving existing process flows.

    Good use-case candidates include: any scenario that involves multiple parties wasting time and resources reconciling data when all should be viewing the same data; situations where fraud arises from lack of timely information; and processes where efficiency gains and other benefits can be achieved if all participants have visibility across an entire supply or value chain.

Blockchain is an emerging technology.
Success of a blockchain solution depends on agreement within the ecosystem.

This won’t happen overnight. Like all digital transformation initiatives, blockchain projects need a long-term, strategic approach, and the business aspects are often a greater challenge than those posed by technology, even one as early-stage as blockchain. The industry is at the point, though, where Forrester is seeing projects transition beyond the pilot stage.

In terms of adoption, the financial services sector was the trailblazer for investigating enterprise use cases that leverage the concepts and architectural principles underpinning cryptocurrency and public blockchain networks. Other industries have caught up fast, though, and Forrester is seeing projects in all industry segments.

In terms of adoption, the financial services sector was the trailblazer for investigating enterprise use cases that leverage the concepts and architectural principles underpinning cryptocurrency and public blockchain networks. Other industries have caught up fast, though, and Forrester is seeing projects in all industry segments.

Whether it’s opening up completely new opportunities or addressing existing pain points, these initiatives all have one aspect in common: blockchains aim to transform entire ecosystems, where participants agree that either a pain point needs to be addressed or a new opportunity can be exploited; and most importantly, they agree that blockchain is a viable step toward a solution.

The majority of enterprise projects today focus on processes that are broken – those that have friction due to cumbersome data reconciliation processes, or those that waste time (often involving perishable goods) due to a lack of visibility along the value chain. Critics point out that for many of these projects, the immediate benefits come from digitization and process redesign, not blockchain. While that may be true, it misses the fact that putting in place a blockchain-based solution lays the foundation for strategic reinvention of processes as well as new business models that would otherwise not be possible.


Getting Started With Blockchain

To determine whether a blockchain-based solution presents an opportunity to your business, start with answering several qualifying questions.

Source: Martha Bennett "Forrester Flash: Blockchain," Forrester Research, Inc., February 14, 2018.

Business challenges of blockchain are often greater than those posed by technology.

If the answer to all of these questions is “yes,” it is worth considering a blockchain-based solution — provided that the pain point you’ve identified is shared by other ecosystem players, or you have identified partners that are interested in exploring a new opportunity with you. Now comes the hard part: laying down your requirements in detail — both in technology terms (e.g., scalability and confidentiality) and non-technology terms (e.g., regulatory compliance, rights and responsibilities of network participants). Those requirements will determine your governance model as well as your technology choice. Many projects fail at this hurdle, and others are held up at the last minute due to lack of, for example, regulatory approval or appropriate legal frameworks.

Last, but by no means least, your organization will need to think big but start small. Realizing the full potential of blockchain-based networks will take time — the winners will be those who start working with the technology today and, through first-hand experience, learn to make the most of blockchain-based networks.

To realize the true potential of blockchain technology, organizations need to think big but start small.

Over the next several sections of this case study, we’ll be looking at organizations that have decided to partner with IBM to develop a blockchain solution and quantify the potential impact blockchain products may have for an organization.


The IBM Blockchain Customer Journey

Interviewed Organizations

For this study, Forrester conducted six interviews with Microsoft Unified Support customers. Interviewed customers include the following:

  • Alectra Utilities and Interac Corp.

    Partners in developing a blockchain solution to optimize distributed energy resources (e.g., energy supplied from consumer solar roofs) and to incentivize consumers to pursue energy savings initiatives.

  • Chainyard, an IT People Company.

    A consulting company working in partnership with IBM to advise and support organizations in blockchain adoption, development, and implementation.

  • we.trade.

    A joint venture of nine major European banks developing a blockchain platform to reduce costs associated with export/import trade financing for small- to medium-sized businesses.

  • SecureKey.

    Developing a blockchain platform to provide consumers a fast, trustworthy and secure way to verify their identity to register for a range of services including banking, telecommunications and government with a world-leading triple-blind privacy model.

  • Global transport and logistics.

    Organization developing a global trade blockchain solution to reduce friction points in global trade, transport, and logistics.

In this study, Forrester refers to organizations who engage with IBM to form the network as founders.

Why IBM Blockchain

Interviewed organizations chose IBM’s Blockchain Platform and Services for the following reasons:

  • IBM is seen as a reliable long-term partner.

    Interviewees told Forrester that for them blockchain was a long-term project and they wanted to minimize the risk of the investment by partnering with an organization with a proven track record, large customer base, and experience in the field.

  • IBM helps identify potential partners and serves as a facilitator during negotiations.

    Several interviewed organizations told Forrester that IBM introduced them to their future blockchain partners and, after the introduction, served as a facilitator in developing a governance model. While many blockchain ventures fail due to unresolved conflicts between founders, IBM helped guide several organizations to focus on the common goal and find consensus in the initial project stages.

  • IBM’s deep technical expertise in blockchain helps bring blockchain ideas to life faster with fewer resources.

    Compared to developing a blockchain-based solution from scratch and relying on internal resources and infrastructure to operate it, interviewed customers enjoy end-to-end lifecycle support from IBM Blockchain Services, from ideation to pilot to full-scale solution development.

  • Permissioned blockchain guarantees control over who joins and how they access information.

    Considering the tradeoff of being on a larger public blockchain or a permissioned blockchain, organizations chose to have control over who joins their blockchain-based solution. A permissioned blockchain allows organizations to implement required privacy features by making only portions of information available to members, and enables the membership benefit module discussed in the financial analysis section of this study.

  • Collaboration on identifying and solving network problems enables innovation.

    Interac Corp. told Forrester: “The Linux Foundation’s Hyperledger Fabric and our partnership with IBM allows us to create this dynamic, fast-adapting framework where we can test things out. That gives us the ability to experiment before committing to a more formalized service or product.”

A permissioned blockchain is a closed ecosystem in which participants require permission to access that blockchain.
“IBM is the glue; they help broker relationships, and there is tremendous value in the relationship management capabilities they provide. Without IBM, we wouldn't have a project.”

– Interac Corp., financial services industry


How To Use An Emerging Technology TEI Case Study

Hyperledger Fabric is a blockchain framework intended as a foundation for developing business applications or solutions with a modular architecture.

There are two aspects that make the TEI analysis of IBM’s Blockchain solution unique:

  • Interviewed organizations are implementing a wide range of applications and use cases using IBM Blockchain.

  • Interviewed organizations for this case study have yet to deploy their full solution using IBM Blockchain Platform and Services.

As such, an emerging technology TEI methodology and framework is applied for this case study and analysis. Benefit and cost modules are abstracted from the interviewed organizations’ specific use-case deployments and generalized to a wider range of applications.

Readers should evaluate which benefit and cost modules are applicable for a specific blockchain application, and then calculate the associated financial analysis using the framework provided in the next sections; it is possible that organizations could experience more than one of the identified benefit modules for a given blockchain solution.

A sample calculation combining a benefit module with the appropriate costs is provided at the end of the Financial Analysis section, as an example of how this analysis framework could be applied to your organization.

“Blockchain is a long-term solution. It was important to us to find a partner we knew was in it for the long haul, and not just some startup that would disappear in six months. We chose IBM because they have a track record, they have experience. Being in the industry already, and with their brand, they’re a top-tier player and service provider.”

– Alectra, utilities industry


Financial Model Framework

FRAMEWORK FOR PROJECTING BENEFITS AND COSTS

At this stage of the market and development, blockchain solutions are unique, project-based use cases specific to each organization’s goals for the platform. As discussed in the Customer Journey section above, Forrester discovered a wide range of use cases for specific blockchain implementations. However, throughout the customer interviews, common themes became clear in how organizations benefited from their blockchain solutions, and Forrester abstracted the benefits and costs into the modules described in the following sections.

At a high level, the benefit modules can be categorized as either creating new opportunities (green) or solving existing pain points (blue). Costs are categorized as being incurred during the pilot phase, commercialization phase, and ongoing operation phase.


Risk Treatment For Benefits And Costs Projections

Financial modeling based on projections inherently introduces more risk than analyzing actual, realized benefits and costs. Therefore, the emerging technology TEI methodology includes an adjustment of projections by incorporating a risk factor.

For benefit calculations, Forrester incorporates risk by developing a range of projected outcomes, based on the data acquired during customer interviews. Low, mid-range, and high-point estimates are included for each input variable in the benefit financial models. This creates a potential benefit range.

For the IBM Blockchain costs analysis, organizations were able to articulate incurred costs through their current phase of implementation, and more accurately estimate projected ongoing costs. Data was also provided by IBM for specific implementation costs. For this reason, Forrester uses a simplified approach for risk treatment of cost categories by adjusting costs upward in order to develop a conservative financial analysis. This is described further in the Costs Analysis section.

Impact risk is the risk that the business or technology needs of the organization may not be met by the investment, resulting in a range of overall total benefits. The greater the uncertainty, the wider the potential range of outcomes for benefit estimates.

Implementation risk is the risk that a proposed investment may deviate from the original or expected requirements, resulting in higher costs than anticipated. The greater the uncertainty, the wider the potential range of outcomes for cost estimates.


Benefit Modules

FRAMEWORK FOR PROJECTING BENEFITS ASSOCIATED WITH IBM BLOCKCHAIN


Membership Revenue

Category: new opportunity

Interviewed organizations described revenue from membership fees as a benefit associated with their blockchain solution. The magnitude of this benefit is dependent on the following factors:

  • Number of new members onboarded onto the platform annually.

  • Onboarding fee for new members.

  • Annual membership fee.

  • Annual membership churn. This factor reduces the number of members paying annual membership fees. The framework presented here conservatively assumes that any members lost to churn do not pay any annual fees, prorated or otherwise.

Sample use cases:
  • Trade finance

  • Identity management

  • IoT

The framework for calculating projected benefits related to membership revenue is shown in the illustration below. Refer to Appendix B for the full calculation framework.

Based on data gathered during the customer interviews, the following table shows a low projection sample calculation (LOW) using the framework illustrated above. Note that projections for your organization will vary based on the actual blockchain solution deployed.

Membership Revenue: Low Projection Sample Calculation

Ref. Metric Calc. Year 1 Year 2 Year 3 Year 4 Year 5
A1LOW New members added annually Input 8 8 8 8 8
A2LOW Onboarding fee Input $250,000 $250,000 $250,000 $250,000 $250,000
A3LOW Annual membership churn Input 0% 0% 0% 0% 0%
A4LOW Total members (A4prior+A1current)*(1-A3) 8 16 24 32 40
A5LOW Annual fee Input $200,000 $200,000 $200,000 $200,000 $200,000
AtLOW Membership revenue A1*A2 + A4*A5 $3.6M $5.2M $6.8M $8.4M $10M

The following table and figure show a projected range (PR) of revenue outcomes based on the data gathered during the customer interviews. Note that the projection range for your organization will vary based on the actual blockchain solution deployed and associated revenue model.

Membership Revenue: Projection Range Sample Calculation (Five-Year PV)

Ref. Metric Low Mid High
A1PR New members added annually 8 12 16
A2PR Onboarding fee $250,000 $300,000 $350,000
A3PR Annual membership churn 0% 0% 0%
A4PR Total members by year 5 40 60 80
A5PR Annual fee $200,000 $250,000 $300,000
AtPR Membership revenue (Five-Year PV) $24,625,715 $45,604,597 $72,360,830

Membership Benefit Module: Range Of Five-Year Cumulative Impact, PV


Transaction Revenue

Sample use cases:
  • Car leasing and sharing

  • Property registration

  • P2P energy trading

Category: new opportunity

Several interviewed organizations expect to generate their revenue by charging blockchain customers a transaction fee for every transaction completed on the blockchain platform.

The magnitude of this benefit is dependent on the following factors:

  • Number of new customers using the blockchain platform annually.

  • Number of transactions completed by each customer per year.

  • Price per transaction.

  • Percentage charged per transaction.

  • Change in percentage of transaction price charged by blockchain founder as customer base grows.

The framework for calculating projected benefits related to transaction revenue is shown in the illustration below. Please refer to Appendix B for the full calculation framework.

Based on data gathered during the customer interviews, the table below shows a low projection sample calculation (LOW) using the framework presented above. Note that projections for your organization will vary based on the actual blockchain solution deployed.

Transaction Revenue: Low Projection Sample Calculation

Ref. Metric Calc. Year 1 Year 2 Year 3 Year 4 Year 5
B1LOW Number of customers Input 1,500,000 2,500,000 3,500,000 4,500,000 5,500,000
B2LOW Number of annual transactions per customer Input 2 2 2 2 2
B3LOW Price per transaction Input $1.75 $1.75 $1.75 $1.75 $1.75
B4LOW Original percentage of founder charge per transaction Input 18% 18% 18% 18% 18%
B5LOW 3% annual reduction in founder charge per transaction Input 100% 97% 94% 91% 88%
B6LOW Founder revenue per transaction B4*B5 18.00% 17.46% 16.92% 16.38% 15.84%
BtLOW Transaction revenue B1*B2*B3*B6 $945K $1.5M $2.1M $2.6M $3.0M

The following table and figure show a projected range (PR) of revenue outcomes based on the data gathered during the customer interviews. Note that the projection range for your organization will vary based on the actual blockchain solution deployed and associated revenue model.

Transaction Revenue: Projection Range Sample Calculation (Five-Year PV)

Ref. Metric Low Mid High
B1PR Total customers by Year 5 5,500,000 7,500,000 8,100,000
B2PR Number of annual transactions per customer 2 4 6
B3PR Price per transaction $1.75 $2.00 $2.25
B4PR Original percentage of founder charge per transaction 18% 19% 20%
B5PR Annual decrease in founder charge per transaction with customer base expansion 3% decrease annually 3% decrease annually 4% decrease annually
BtPR Transaction revenue (Five-Year PV) $7,334,330 $22,456,466 $40,323,801

Transaction Benefit Module: Range Of Five-Year Cumulative Impact


CapEx And OpEx Savings

Category: solves existing pain points

Interviewed organizations told Forrester that the IBM Blockchain solution would allow them to do more with their current assets by providing access to resources available through other blockchain partners. Because of this, organizations expect to avoid or reduce both capital expenses (CapEx) and operating expenses (OpEx).

The magnitude of this benefit will vary based on the following factors:

  • The type and magnitude of the investment avoided. Forrester uses capital expenses as an illustration. In the framework calculation below, Forrester accounts for infrastructure and operating costs.

  • Time and frequency of necessary investments. Forrester assumes that there is an avoided capital investment every three years.

Sample use cases:
  • Fleet management

  • Energy distribution

The framework for calculating projected benefits related to CapEx and OpEx savings is illustrated below. Note that other cost avoidance and savings benefits are possible with blockchain solutions, however we are only looking at CapEx and OpEx for this case study. Refer to Appendix B for the full calculation framework.

Based on data gathered during the customer interviews, the table below shows a low projection sample calculation (LOW) using the framework presented above. Note that projections for your organization will vary based on the actual blockchain solution deployed.

CapEx And OpEx Savings: Low Projection Sample Calculation

Ref. Metric Calc. Year 1 Year 2 Year 3 Year 4 Year 5
C1LOW CapEx avoided $2,000,000 $0 $0 $2,000,000 $0
C2LOW Avoided additional infrastructure costs (taxes, transportation, special features and accessories, special testing) C1*30% $600,000 $0 $0 $600,000 $0
C3LOW Subtotal: CapEx savings C1+C2 $2,600,000 $0 $0 $2,600,000 $0
C4LOW Total CapEx costs avoided (cumulative for five years) Costs avoided in Year 1 + Year 4 $2,600,000 $2,600,000 $2,600,000 $5,200,000 $5,200,000
C5LOW OpEx required as a percentage of CapEx 20% 20% 20% 20% 20%
C6LOW Subtotal: OpEx savings C4*C5 $520,000 $520,000 $520,000 $1,040,000 $1,040,000
CtLOW CapEx and OpEx savings C3+C6 $3,120,000 $520,000 $520,000 $3,640,000 $1,040,000

The following table and figure show a projected range (PR) of revenue outcomes based on the data gathered during the customer interviews. Note that the projection range for your organization will vary based on the actual blockchain solution deployed and associated revenue model.

CapEx And OpEx Savings: Projection Range Sample Calculation (Five-Year PV)

Ref. Metric Low Mid High
C1PR CapEx avoided per instance $2,000,000 $5,000,000 $8,000,000
C2PR Avoided additional infrastructure costs per instance (taxes, transportation, special features and accessories, special testing, etc.) $600,000 $1,500,000 $2,400,000
C5PR OpEx required as a percentage of CapEx 20% 20% 20%
CtPR CapEx and OpEx cost avoidance (Five-Year PV) $6,788,727 $16,971,816 $27,154,906

CapEx And OpEx Savings: Range Of Five-Year Cumulative Impact, PV


Efficiency Savings

Category: solves existing pain points

Interviewed organizations described efficiencies as one of the key opportunities to reducing their expenses with IBM Blockchain. Examples include streamlined billing, eliminated disputes stemming from inconsistent documentation, and replacing legacy systems and tools by a single IBM Blockchain Platform. Forrester explored several components to measuring internal efficiency improvements:

The magnitude of efficiency savings will vary based on:

  • Number of records (i.e., invoice, shipping document) handled by an organization, average cost to process a record, percentage of records conflicting in the customer’s (and their counterpart’s) systems, and average cost to resolve a dispute over a record.

  • License cost of legacy systems and organization’s approach to replacing them with a solution built with IBM Blockchain Platform and Services.

  • Number of employees re-assigned from using a solution built with IBM Blockchain Platform and Services and their annual compensations.

Sample use cases:
  • Dispute resolution

  • Supply chain visibility

  • Identity management

The framework for calculating projected benefits related to efficiency improvements is illustrated below. Refer to Appendix B for the full calculation framework.

Based on data gathered during the customer interviews, the table below shows a low projection sample calculation (LOW) using the framework presented above. Note that projections for your organization will vary based on the actual blockchain solution deployed.

Efficiency — Streamlined Documentation: Low Projection Sample Calculation

Ref. Metric Calc. Year 1 Year 2 Year 3 Year 4 Year 5
D11-LOW Total records Input 20,000 20,000 20,000 20,000 20,000
D21-LOW Percentage of conflicting records Input 5% 5% 5% 5% 5%
D31-LOW Number of conflicting records that require resolution D11*D21 $1,000 $1,000 $1,000 $1,000 $1,000
D41-LOW Average cost to resolve a dispute Input $200 $200 $200 $200 $200
D51-LOW Projected reduction in conflicting records with blockchain Input 100% 100% 100% 100% 100%
D61-LOW Subtotal: Savings due to reduction in conflicting records D31*D41*D51 $200,000 $200,000 $200,000 $200,000 $200,000
D71-LOW Average cost for record processing Input $20 $20 $20 $20 $20
D81-LOW Reduction in cost per record Input 25% 25% 25% 25% 25%
D91-LOW Subtotal: Savings due to reduction in cost of records processing D11*D71*D81 $100,000 $100,000 $100,000 $100,000 $100,000
Dt1-LOW Savings for records processing D61+D91 $300K $300K $300K $300K $300K

Interviewees told Forrester that they plan to replace existing software tools and systems used for tracking or billing with the IBM Blockchain solution. A framework for calculating savings from eliminated or reduced legacy systems is illustrated below.

Based on data gathered during the customer interviews, the table below shows a low projection sample calculation (LOW) using the framework presented above. Note that projections for your organization will vary based on the actual blockchain solution deployed and associated savings model.

Efficiency — Reduced Legacy Systems: Low Projection Sample Calculation

Ref. Metric Calc. Year 1 Year 2 Year 3 Year 4 Year 5
D12-LOW Legacy systems cost Input $150,000 $150,000 $150,000 $150,000 $150,000
D22-LOW Percentage of legacy systems replaced by IBM Blockchain Input 10% 50% 80% 100% 100%
Dt2-LOW Invoicing software license savings D12*(1-D22) $15K $75K $120K $150K $150K

Interviewed organizations explained to Forrester that they project a reduction in labor costs to their finance and legal teams as a result of transitioning to IBM Blockchain due to: reduced paperwork; reduced number of checkpoints; reduced number of inconsistent records and human error, a decrease in the number of conflicting records, and improved compliance.

Based on data gathered during the customer interviews, the table below shows a low projection sample calculation (LOW) using the framework presented above. Note that projections for your organization will vary based on the actual blockchain solution deployed and associated savings model.

Efficiency — Labor Cost Reduction: Low Projection Sample Calculation

Ref. Metric Calc. Year 1 Year 2 Year 3 Year 4 Year 5
D13-LOW Number of finance FTEs resolving conflicting records prior to IBM Blockchain Input 4 4 4 4 4
D23-LOW Finance FTEs annual compensation Input $75,000 $75,000 $75,000 $75,000 $75,000
D33-LOW Reduction to finance resources dedicated to resolving conflicting records from use of IBM Blockchain Input 20% 40% 60% 80% 80%
D43-LOW Savings due to reduction in finance FTEs D13*D23*D33 $60,000 $120,000 $180,000 $240,000 $240,000
D53-LOW Number of legal FTEs resolving conflicting records prior to IBM Blockchain Input 3 3 3 3 3
D63-LOW Legal FTEs annual compensation Input $200,000 $200,000 $200,000 $200,000 $200,000
D73-LOW Reduction to legal resources resolving conflicting records with IBM Blockchain Input 0% 30% 50% 70% 70%
D83-LOW Savings due to reduction in legal FTEs D53*D63*D73 $0 $180,000 $300,000 $420,000 $420,000
Dt3-LOW Operating expense savings D43+D83 $60K $300K $480K $660K $660K

The following table and figure show the projected range (PR) of revenue outcomes based on the data gathered during the customer interviews. Note that the projection range for your organization will vary based on the actual blockchain solution deployed and applicable efficiencies.

Efficiency: Projection Range Sample Calculation (Five-Year PV)

Ref. Metric Low Mid High
D11-PR Total records 20,000 50,000 80,000
D21-PR Percentage of conflicting records 5% 7% 9%
D41-PR Average cost to resolve a dispute $200 $250 $300
D51-PR Reduction in conflicting records with blockchain by end of Year 5 100% 100% 100%
D71-PR Average cost for record processing $20 $22 $25
D81-PR Reduction in cost per record 25% 30% 35%
D12-PR Legacy software systems cost $150,000 $200,000 $250,000
D22-PR Percentage of legacy systems replaced by IBM Blockchain by end of Year 5 100% 100% 100%
D23-PR Finance FTE annual compensation $75,000 $75,000 $75,000
D33-PR Reduction in finance resources with IBM Blockchain by end of Year 5 80% 80% 80%
D63-PR Legal FTE annual compensation $200,000 $200,000 $200,000
D73-PR Reduction in legal resources with IBM Blockchain by end of Year 5 70% 70% 70%
DtPR Business efficiencies (Five-Year PV) $3,022,311 $6,723,904 $13,625,530

Efficiency: Range Of Five-Year Cumulative Impact, PV


Other Potential Benefits Modules

The analysis above provides a framework for evaluating benefits as projected by interviewed organizations from their specific blockchain solutions. However, there are other potential benefits associated with blockchain solutions that are not quantified or developed into a benefit module or framework as no specific data was collected during the interviews. Some examples include:

  • Market share capture.

    As a potential result of specific blockchain applications, organizations may see an increase in new or existing market share capture. This benefit could be quantified by evaluating potential market size, and then estimating an increase in market share capture due to either IBM Blockchain Platform technology or reduced time-to-market provided by IBM Blockchain Services.

  • Revenue acceleration.

    IBM Blockchain Services allowed organizations to reduce their expected time-to-market for their blockchain solution. This benefit could be quantified by evaluating the accrual of revenue or internal cost savings associated with that reduced time-to-market.

  • Fraud avoidance.

    The distributed and tamper-resistant nature of blockchain platforms could reduce the likelihood of fraud that may be inherent to specific industries. The value this benefit provides could be quantified by evaluating fraud risk exposure and calculating the resultant risk reduction that could be realized from implementing a blockchain-based solution.

  • Inventory loss avoidance.

    Blockchain platforms could improve efficiency and provide clarity and insight into the overall supply chain. This benefit could be quantified by identifying the efficiencies and savings that blockchain delivers to your organization. For example, moving to blockchain-based supply management can reduce food spoilage by shortening the time to get through the supply chain, or by identifying the specific food shipments that may be spoiled or otherwise contaminated during a recall. This allows an organization to avoid destroying the entire inventory of a product for overconservative safety precautions.


Expanded Economic Impact

In addition to business benefits associated with implementing blockchain solutions, each of the interviewed organizations noted that the nature of the blockchain solutions being implemented had a much broader impact for improved customer experience, the surrounding community and economy, and the overall greater good. For example:

  • Alectra Utilities and Interac Corp.

    Partners in developing a blockchain solution to optimize distributed energy resources (e.g., energy supplied from consumer solar roofs) and incentivize consumers to pursue energy savings initiatives.

    • This platform has the potential to impact consumer behavior, ultimately leading to carbon and greenhouse gas reduction and overall more efficient use of energy. There’s also the potential to incentivize green initiatives such as utilizing public transportation or biking to work to further contribute to environmental protection.

  • we.trade.

    A joint venture of nine major European banks developing a blockchain platform to reduce costs associated with export/import trade financing for small- to medium-sized businesses.

    • This platform has the potential to lead larger growth in the overall economy by reducing barriers to international trade for small- to medium-sized businesses.

  • SecureKey.

    Developing a blockchain platform to provide consumers a fast, trustworthy and secure way to verify their identity to register for a range of banking and government services with a world-leading triple- blind privacy model.

    • In the sharing economy, it can increase the level of mutual trust between a consumer looking to rent an asset and the asset owner, while limiting the amount of detailed personally identifiable information (PII) required for reference checks. Another example would be the ability to provide age verification without having to give out a consumer’s actual birthdate. More involved registrations for banking, insurance, healthcare, and government services can realize substantial savings - on the order of 50-75% over current methods.

  • Global transport and logistics.

    Organization developing a global trade blockchain platform to reduce friction points in global trade, transport, and logistics.

    • More efficient trade processes could reduce global trade costs. Additionally, reducing global trade barriers could significantly increase international trade volume and cut shipping costs and times to consumers.

Alectra and Interac Corp. aim to teach consumers to use energy responsibly.
we.trade is working to grow the global economy by increasing international trade for small- to medium-sized businesses.
SecureKey is looking to increase trust, security and privacy in the sharing economy while lowering costs and breach risks for businesses.
Global transport and logistics company plans to help grow global trade

Analysis Of Costs

FRAMEWORK FOR PROJECTING COSTS ASSOCIATED WITH IBM BLOCKCHAIN

Pilot Phase Costs

Interviewed organizations described the following costs related to the development of the minimal viable product (MVP) with IBM Blockchain:

  • Several interviewees described attending IBM Cloud Garage or IBM Design Thinking workshop as a part of their blockchain ideation process.

  • Several organizations engaged with an IBM Blockchain architecture consultant to help them through their blockchain prototype.

  • All organizations paid a fee to IBM Services for their MVP build-up.

  • Organizations incurred internal IT and developer expenses.

  • Since legal professionals, IT leaders, and business owners needed to get involved in a pilot to develop a governance model, blockchain founders incurred labor costs of all professionals involved.

This cost can vary due to uncertainty related to:

  • Complexity of the blockchain pilot phase and the number of internal employees involved.

  • Employee annual compensation.

  • Project duration.

  • Complexity of developing a governance model and all participants commitment to the project.

The pilot cost calculation framework is illustrated below. Refer to Appendix B for the full calculation framework.


Commercialization Costs

Following the pilot phase, interviewed organizations continued to develop a fully commercialized blockchain solution, including additional development efforts to further negotiations regarding the governance model and onboarding blockchain members.

  • Several interviewees engaged IBM Blockchain Services to facilitate additional IBM’s Design Thinking workshops for ideation of the full blockchain model.

  • Interviewees described agreement and contract negotiations as an essential part of moving their blockchain efforts forward. Blockchain success is dependent on blockchain members alignment, therefore, significant effort went into the development of a comprehensive governance model.

  • Several interviewed organizations shared that this phase took about 12 months. At the time of these interviews, the majority of interviewees were at the end of this phase.

  • Organizations incurred additional internal IT and developer expenses.

  • There was an additional cost to inform and onboard potential blockchain members. Depending on the application, members could include founders’ partner organizations, other vendors or merchants, or individuals who would be using the IBM Blockchain Platform in the future.

This cost can vary due to uncertainty related to:

  • Scale and complexity of the blockchain-based solution and the number of internal employees involved during commercialization.

  • Internal employee compensation.

  • Project duration.

  • Complexity of developing a governance model and all participants commitment to the project.

A framework for calculating the cost of a full-scale commercialized blockchain-based solution is presented below. Refer to Appendix B for the full calculation framework.


Ongoing Costs

While none of the interviewed organizations could share financial results of running a fully commercialized blockchain, based on the interviews, Forrester estimates that a blockchain founder will incur the following expenses of running an IBM Blockchain solution:

  • IBM Blockchain Platform license fee.

  • A fee to IBM Blockchain Services to develop additional features and upgrade the platform.

  • Cost of internal IT and developer resources to operate and support the blockchain.

  • Cost of internal IT leaders’, business owners’, and legal professionals’ resources aimed to support the governance model and manage negotiations with new and existing blockchain members.

  • Cost of onboarding new members.

  • Cost of member relationship management and developing a blockchain ecosystem.

This cost can vary based on:

  • A number of internal employees supporting a fully functional blockchain.

  • Internal employee compensation.

  • Cost to onboard a new member and number of new members onboarded annually.

  • Blockchain members’ commitment to operate in accordance with a governance model.

  • A founder’s effort to build relationships between members and develop an ecosystem.

A framework for calculating the ongoing costs of a blockchain-based solution is presented below. Refer to Appendix B for the full calculation framework.


Sample Organization Calculation

The organization pursues new opportunities with a blockchain-based solution.

To illustrate how readers can apply the framework to estimate the ROI and NPV of a particular IBM Blockchain-based application, Forrester constructed a TEI framework, a sample company, and an associated ROI analysis that illustrates the areas financially affected. The sample organization that Forrester synthesized from customer interviews has the following characteristics:

  • The organization engages IBM Blockchain Services to help explore their blockchain idea and develop a pilot. A pilot phase takes about six months.

  • Following a successful pilot, the organization decides to develop a full commercial version of its blockchain application and starts to recruit members to join the blockchain.

  • The organization plans to charge a fee for each transaction conducted by a customer on the blockchain platform.

  • The organization plans to onboard 12 new members (merchants or vendors) to join the platform every year. The organization charges a fee to join the network and an additional annual membership fee.

Forrester uses two benefit modules, membership and transaction, to calculate the benefits of investing into this blockchain-based solution.


QUANTIFIED BENEFIT DATA AS APPLIED TO THE SAMPLE ORGANIZATION

To determine the range of possible financial outcomes from the membership revenue benefit, Forrester assumes:

  • Each new member pays a one-time fee upon joining the network, ranging from $5,000 (low projection) to $7,500 (high projection).

  • The organization charges each member an annual fee, ranging from $10,000 to $15,000

  • At present the sample organization sees no churn on its network.

The following table shows the projected range of membership revenue outcomes for the sample organization. Note that the projection range for your organization will vary based on the actual blockchain-based solution deployed. See Appendix B for detailed calculations for the low projection.

Total Benefits

Ref. Benefit Year 1 Year 2 Year 3 Year 4 Year 5 Total Present Value
Ctr Cost of pilot $470,707 $0 $0 $0 $0 $470,707 $470,707
Dtr Commercialized Dtr blockchain development $2.2M $0 $0 $0 $0 $2.2M $2.2M
Etr Blockchain ongoing management $0 $924,000 $924,000 $924,000 $924,000 $4.6M $3.5M
Total benefits (risk-adjusted) $2.7M $924K $924K $924K $924K $7.3M $6.2M

The table above shows the total of all costs across the areas listed below, as well as present values (PVs) discounted at 10%. Over three years, the sample organization expects risk-adjusted total costs to have a PV of $6.2 million.

As a part of the pilot phase, the sample organization worked with IBM to finalize its original idea and relied on IBM Blockchain Services to provide help with platform development and with the governance model. Forrester assumes that:

  • This phase lasted six months.

  • The organization participated in one IBM Design Thinking workshop.

  • Internally, five developers / information technology (IT) professionals were involved in the initiative for 15% of their time for the full six months of the project duration.

  • A legal professional and a business owner were also involved in negotiations and developing a governance model for 20% of their time over the course of six months.

Refer to Appendix B for the full calculation. To account for variation in the inputs, Forrester adjusted this cost upward by 20%, yielding a five-year risk-adjusted total PV of $470,707.


Once the initial pilot program was complete, the organization decided to develop a full-scale blockchain solution and start onboarding members to join the network. For the sample organization, Forrester assumes that:

  • It takes the organization 12 months to develop a full-scale blockchain platform, ready for onboarding members.

  • It participates in two new IBM Design Thinking workshops.

  • Five IT professionals and software engineers dedicate 15% of their time to support the project.

  • Three legal and business professionals dedicate 20% of their time to negotiations and developing governance model for the blockchain.

  • Organizations spends $5,000 in administration, communication, and marketing to onboard each new blockchain member.

  • Prior to full launch, the organization has onboarded three members.


Refer to Appendix B for the full calculation. To account for variation in the inputs, Forrester adjusted this cost upward by 20%, yielding a five-year risk-adjusted total PV of $2,197,803.

Upon full deployment, the sample organization continues to invest into the blockchain for maintenance and growth. Forrester estimates that:

  • The organization continues to pay an annual IBM Blockchain Platform license fee.

  • The organization also pays an IBM Blockchain Services fee for support, new features, and upgrades to the IBM Blockchain Platform.

  • Internally, three IT / software engineering professionals dedicate 20% of their time to platform maintenance.

  • One full-time legal professional handles contracts and the governance model.

  • Twelve new members are onboarded each year.

  • The organization spends $200,000 per year to manage relations with the blockchain members.

Refer to Appendix B for the full calculation. To account for variation in the inputs, Forrester adjusted this cost upward by 20%, yielding a five-year risk-adjusted total PV of $3,502,687.

The following section details the results of the benefits and costs calculations for the sample organization.


Sample Organization Calculation

CONSOLIDATED FIVE-YEAR RISK-ADJUSTED METRICS

Sample Organization Calculation: Projection Range Values (Five-Year PV)

Metric Low Mid High
Total costs ($6,171,197) ($6,171,197) ($6,171,197)
Total benefits $8,840,088 $24,263,375 $42,582,438
Net benefits $2,668,891 $18,092,179 $36,411,241
ROI 43% 293% 590%
Payback period 36 months 16 months 10 months

Sample Organization Calculation: Range Of Five-Year Net Present Value

IBM Blockchain: Overview

The following information is provided by IBM. Forrester has not validated any claims and does not endorse IBM or its offerings.

The world’s most innovative companies in finance, logistics, consumer goods, energy, healthcare, transportation, manufacturing and others are turning to IBM Blockchain to create mission-critical applications and networks that deliver tangible business success.

They recognize that even in today’s digital economy, vast amounts of value continue to be trapped inside processes and organizations that don’t connect. IBM Blockchain Services is their remedy, helping them discover and design business value in blockchain networks – starting, accelerating and innovating strategies that replace longstanding business friction with trust and transparency. Backed by the insights of more than 1,500 blockchain and industry experts, IBM Blockchain Services provides proven methodologies and advanced technologies to drive game-changing business outcomes across hundreds of value-producing networks.

Central to each company’s journey is the IBM Blockchain Platform, the catalyst that enables true blockchain innovators to disrupt industry. Featuring today’s most complete and secure set of production-ready business blockchain tools and services, the platform helps users accelerate the development, governance, operation and monetization of a multi-institution permissioned blockchain* network through all life cycle stages. Powered by the open-source Hyperledger Fabric framework from The Linux Foundation, it provides the tools to quickly build or launch blockchain enterprise applications, accelerating the progression path from initial proof-of-concept to full- scale production, all protected by the unparalleled security of the IBM Cloud.

*A permissioned blockchain is the key to enterprise blockchain, enabling the accountability needed for the institutions participating in the blockchain network to do know your customer (KYC) on members and pass audits.

This study was conducted by Forrester’s Custom Content Consulting Practice. Get in touch to discuss your custom content needs and goals. And to learn more about all of Forrester's consulting capabilities, click here.

Appendix A: Emerging Technology Total Economic Impact

Total Economic Impact is a methodology developed by Forrester Research that enhances a company’s technology decision-making processes and assists vendors in communicating the value proposition of their products and services to clients. The TEI methodology helps companies demonstrate, justify, and realize the tangible value of IT initiatives to both senior management and other key business stakeholders.

Total Economic Impact Approach

  • Benefits represent the projected value delivered to the business by the product. The TEI methodology places equal weight on the measure of benefits and the measure of costs, allowing for a full examination of the effect of the technology on the entire organization.

  • Costs consider all expenses necessary to deliver the proposed value, or benefits, of the product. The cost category within TEI captures incremental costs over the existing environment for ongoing costs associated with the solution.

  • Flexibility represents the strategic value that can be obtained for some future additional investment building on top of the initial investment already made. Having the ability to capture that benefit has a PV that can be estimated.

  • Risks measure the uncertainty of benefit and cost estimates given: 1) the likelihood that estimates will meet original projections and 2) the likelihood that estimates will be tracked over time.

  • PRESENT VALUE (PV)

    The present or current value of (discounted) cost and benefit estimates given at an interest rate (the discount rate). The PV of costs and benefits feed into the total NPV of cash flows.

  • NET PRESENT VALUE (NPV)

    The present or current value of (discounted) future net cash flows given an interest rate (the discount rate). A positive project NPV normally indicates that the investment should be made, unless other projects have higher NPVs.

  • RETURN ON INVESTMENT (ROI)

    A project’s expected return in percentage terms. ROI is calculated by dividing net benefits (benefits less costs) by costs.

  • DISCOUNT RATE

    The interest rate used in cash flow analysis to take into account the time value of money. Organizations typically use discount rates between 8% and 16%.

  • PAYBACK PERIOD

    The breakeven point for an investment. This is the point in time at which net benefits (benefits minus costs) equal initial investment or cost.

The initial investment column contains costs incurred at “time 0” or at the beginning of Year 1 that are not discounted. All other cash flows are discounted using the discount rate at the end of the year. PV calculations are calculated for each total cost and benefit estimate. NPV calculations in the summary tables are the sum of the initial investment and the discounted cash flows in each year. Sums and present value calculations of the Total Benefits, Total Costs, and Cash Flow tables may not exactly add up, as some rounding may occur.


BENEFIT MODULES FRAMEWORKS

Membership Revenue: Low Projection Sample Calculation

Ref. Metric Calc. Year 1 Year 2 Year 3 Year 4 Year 5
A1 New members added annually Input
A2 Onboarding fee Input
A3 Annual membership churn Input
A4 Total members (A4prior+A1current)*(1-A3)
A5 Annual fee Input
At Membership revenue A1*A2 + A4*A5

Benefit Module 2: Transaction Benefit Calculation Framework

Ref. Metric Calc. Year 1 Year 2 Year 3 Year 4 Year 5
B1 Number of customers Input
B2 Number of annual transactions per customer Input
B3 Price per transaction Input
B4 Original percentage of founder charge per transaction Input
B5 Annual reduction in founder charge per transaction Input
B6 Founder revenue per transaction B4*B5
Bt Transaction revenue B1*B2*B3*B6

Benefit Module 3: Cost Avoidance

Ref. Metric Calc. Year 1 Year 2 Year 3 Year 4 Year 5
C1 CapEx Avoided Input
C2 Avoided additional infrastructure costs (taxes, transportation, special features and accessories, and special testing) C1*XX%
C3 Subtotal: CapEx Savings C1+C2
C4 Total CapEx costs avoided (cumulative for five years) Input
C5 OpEx required as a percentage of CapEx Input
C6 Subtotal: OpEx Savings C4*C5
Ct CapEx and OpEx savings C3+C6

Benefit Module 4: Efficiency — Streamlined Documentation

Ref. Metric Calc. Year 1 Year 2 Year 3 Year 4 Year 5
D11 Total records Input
D21 Percentage of conflicting records
D31 Number of conflicting records that require resolution D11*D21
D41 Average cost to resolve a dispute Input
D51 Projected reduction in conflicting records with blockchain Input
D61 Subtotal: Savings due to reduction in conflicting records D31*D41*D51
D71 Average cost for record processing Input
D81 Reduction in cost per record Input
D91 Subtotal: Savings due to reduction in cost of records processing D11*D71*D81
Dt1 Savings for records processing D61+D91

Benefit Module 4: Efficiency — Reduced Legacy Systems

Ref. Metric Calc. Year 1 Year 2 Year 3 Year 4 Year 5
D12 Legacy systems cost Input
D22 Percentage of legacy systems replaced by IBM Blockchain Input
Dt2 Legacy systems savings D12*(1-D22)

Benefit Module 4: Efficiency — Labor Cost Reduction

Ref. Metric Calc. Year 1 Year 2 Year 3 Year 4 Year 5
D13 Number of finance FTEs resolving conflicting records prior to IBM Blockchain Input
D23 Finance FTEs annual compensation Input
D33 Reduction to finance resources dedicated to resolving conflicting records from use of IBM Blockchain Input
D43 Savings due to reduction in finance FTEs D13*D23*D33
D53 Number of legal FTEs resolving conflicting records prior to IBM Blockchain Input
D63 Legal FTEs annual compensation Input
D73 Reduction to legal resources resolving conflicting records with IBM Blockchain Input
D83 Savings due to reduction in legal FTEs D53*D63*D73
Dt3 Labor cost savings D43+D83

BENEFIT MODULES (MID-RANGE PROJECTION)

Benefit Module 1: Membership Revenue Calculation Framework (Mid-Range)

Ref. Metric Calc. Year 1 Year 2 Year 3 Year 4 Year 5
A1MID New members added annually Input 12 12 12 12 12
A2MID Onboarding fee Input $300,000 $300,000 $300,000 $300,000 $300,000
A3MID Annual membership churn Input 0% 0% 0% 0% 0%
A4MID Total members (A4prior+A1current)*(1-A3) 12 24 36 48 60
A5MID Annual fee Input $250,000 $250,000 $250,000 $250,000 $250,000
AtMID Membership revenue A1*A2 + A4*A5 $6,600,000 $9,600,000 $12,600,000 $15,600,000 $18,600,000

Benefit Module 2: Transaction Benefit Calculation Framework (Mid-Range)

Ref. Metric Calc. Year 1 Year 2 Year 3 Year 4 Year 5
B1MID Number of customers Input 1,500,000 3,000,000 4,500,000 6,000,000 7,500,000
B2MID Number of annual transactions per customer Input 4 4 4 4 4
B3MID Price per transaction Input $2.00 $2.00 $2.00 $2.00 $2.00
B4MID Original percentage of founder charge per transaction Input 19.00% 19.00% 19.00% 19.00% 19.00%
B5MID Annual reduction in founder charge per transaction Input 100% 97% 94% 91% 88%
B6MID Founder revenue per transaction B4*B5 19.00% 18.43% 17.86% 17.29% 16.72%
BtMID Transaction revenue B1*B2*B3*B6 $2,280,000 $4,423,200 $6,429,600 $8,299,200 $10,032,000

Benefit Module 3: Cost Avoidance (Mid-Range)

Ref. Metric Calc. Year 1 Year 2 Year 3 Year 4 Year 5
C1MID CapEx avoided $5,000,000 $5,000,000
C2MID Avoided additional infrastructure costs (taxes, transportation, special features and accessories, special testing) B1*30% $1,500,000 $1,500,000
C3MID Subtotal: CapEx savings B1+B2 $6,500,000 $6,500,000
C4MID Total CapEx costs avoided (cumulative for five years) 20% 20% 20% 20% 20%
C5MID OpEx required as a percentage of CapEx B1*B4 $1,300,000 $1,300,000 $1,300,000 $1,300,000 $1,300,000
CtMID CapEx and OpEx savings B3+B6 $7,800,000 $1,300,000 $1,300,000 $9,100,000 $2,600,000

Benefit Module 4: Efficiency — Streamlined Documentation (Mid-Range)

Ref. Metric Calc. Year 1 Year 2 Year 3 Year 4 Year 5
D11,LOW Total records Input 50,000 50,000 50,000 50,000 50,000
D21,LOW Percentage of conflicting records Input 7% 7% 7% 7% 7%
D31,LOW Number of conflicting records that require resolution D11*D21 3,500 3,500 3,500 3,500 3,500
D41,LOW Average cost to resolve a dispute Input $250 $250 $250 $250 $250
D51,LOW Projected reduction in conflicting records with blockchain Input 100% 100% 100% 100% 100%
D61,LOW Savings due to reduction in conflicting records D31*D41*D51 $875,000 $875,000 $875,000 $875,000 $875,000
D71,LOW Average cost for record processing Input $22 $22 $22 $22 $22
D81,LOW Reduction in cost per record Input 30% 30% 30% 30% 30%
D91,LOW Savings due to reduction in cost of records processing D11*D71*D81 $330,000 $330,000 $330,000 $330,000 $330,000
Dt1,LOW Savings for records processing D61+D91 $1,205,000 $1,205,000 $1,205,000 $1,205,000 $1,205,000

Benefit Module 4: Efficiency — Reduced Legacy Systems (Mid-Range)

Ref. Metric Calc. Year 1 Year 2 Year 3 Year 4 Year 5
D12,MID Legacy systems cost Input $200,000 $200,000 $200,000 $200,000 $200,000
D22,MID Percentage of legacy systems replaced by IBM Blockchain Input 10% 50% 80% 100% 100%
Dt2,MID Legacy systems savings D12*(1-D22) $20,000 $100,000 $160,000 $200,000 $200,000

Benefit Module 4: Efficiency — Reduced Legacy Systems (Mid-Range)

Ref. Metric Calc. Year 1 Year 2 Year 3 Year 4 Year 5
D13,MID Number of finance FTEs resolving conflicting records prior to IBM Blockchain Input 5 5 5 5 5
D23,MID Finance FTEs annual compensation Input $75,000 $75,000 $75,000 $75,000 $75,000
D33,MID Reduction to finance resources dedicated to resolving conflicting records from use of IBM Blockchain Input 20% 40% 60% 80% 80%
D43,MID Savings due to reduction in finance FTEs D13*D23*D33 $75,000 $150,000 $225,000 $300,000 $300,000
D53,MID Number of legal FTEs resolving conflicting records prior to IBM Blockchain Input 3 3 3 3 3
D63,MID Legal FTEs annual compensation Input $200,000 $200,000 $200,000 $200,000 $200,000
D73,MID Reduction to legal resources resolving conflicting records with IBM Blockchain Input 0% 30% 50% 70% 70%
D83,MID Savings due to reduction in legal FTEs D53*D63*D73 $0 $180,000 $300,000 $420,000 $420,000
Dt3,MID Labor cost savings D43+D83 $75,000 $330,000 $525,000 $720,000 $720,000

Benefit Module 4: Efficiency — Streamlined Documentation (High-Level)

Ref. Metric Calc. Year 1 Year 2 Year 3 Year 4 Year 5
D11,HIGH Total records Input 80,000 80,000 80,000 80,000 80,000
D21,HIGH Percentage of conflicting records Input 9% 9% 9% 9% 9%
D31,HIGH Number of conflicting records that require resolution D11*D21 7,200 7,200 7,200 7,200 7,200
D41,HIGH Average cost to resolve a dispute Input $300 $300 $300 $300 $300
D51,HIGH Projected reduction in conflicting records with blockchain Input 100% 100% 100% 100% 100%
D61,HIGH Savings due to reduction in conflicting records D31*D41*D51 $2,160,000 $2,160,000 $2,160,000 $2,160,000 $2,160,000
D71,HIGH Average cost for record processing Input $25 $25 $25 $25 $25
D81,HIGH Reduction in cost per record Input 35% 35% 35% 35% 35%
D91,HIGH Savings due to reduction in cost of records processing D11*D71*D81 $700,000 $700,000 $700,000 $700,000 $700,000
Dt1,HIGH Savings for records processing D61+D91 $2,860,000 $2,860,000 $2,860,000 $2,860,000 $2,860,000

Benefit Module 4: Efficiency — Reduced Legacy Systems

Ref. Metric Calc. Year 1 Year 2 Year 3 Year 4 Year 5
D12,HIGH Legacy systems cost Input $250,000 $250,000 $250,000 $250,000 $250,000
D22,HIGH Percentage of legacy systems replaced by IBM Blockchain Input 10% 50% 80% 100% 100%
Dt2,HIGH Legacy systems savings D12*(1-D22) $25,000 $125,000 $200,000 $250,000 $250,000

Number of finance FTEs resolving conflicting records prior to IBM Blockchain

Ref. Metric Calc. Year 1 Year 2 Year 3 Year 4 Year 5
D13,HIGH Number of finance FTEs resolving conflicting records prior to IBM Blockchain Input 6 6 6 6 6
D23,HIGH Finance FTEs annual compensation Input $75,000 $75,000 $75,000 $75,000 $75,000
D33,HIGH Reduction to finance resources dedicated to resolving conflicting records from use of IBM Blockchain Input 20% 40% 60% 80% 80%
D43,HIGH Savings due to reduction in finance FTEs D13*D23*D33 $90,000 $180,000 $270,000 $360,000 $360,000
D53,HIGH Number of legal FTEs resolving conflicting records prior to IBM Blockchain Input 4 4 4 4 4
D63,HIGH Legal FTEs annual compensation Input $200,000 $200,000 $200,000 $200,000 $200,000
D73,HIGH Reduction to legal resources resolving conflicting records with IBM Blockchain Input 0% 30% 50% 70% 80%
D83,HIGH Savings due to reduction in legal FTEs D53*D63*D73 $0 $240,000 $400,000 $560,000 $640,000
Dt3,HIGH Labor cost savings D43+D83 $90,000 $420,000 $670,000 $920,000 $1,000,000

BENEFIT MODULES (HIGH-LEVEL PROJECTION)

Benefit Module 1: Membership Revenue Calculation Framework (High-Level)

Ref. Metric Calc. Year 1 Year 2 Year 3 Year 4 Year 5
A1HIGH New members added annually Input 16 16 16 16 16
A2HIGH Onboarding fee Input $350,000 $350,000 $350,000 $350,000 $350,000
A3HIGH Annual membership churn Input 0% 0% 0% 0% 0%
A4HIGH Total members (A4prior+A1current)*(1-A3) 16 32 48 64 80
A5HIGH Annual fee Input $300,000 $300,000 $300,000 $300,000 $300,000
AtHIGH Membership revenue A1*A2 + A4*A5 $10,400,000 $15,200,000 $20,000,000 $24,800,000 $29,600,000

Benefit Module 2: Transaction Benefit Calculation Framework (High-Level)

Ref. Metric Calc. Year 1 Year 2 Year 3 Year 4 Year 5
B1HIGH Number of customers Input 1,500,000 3,000,000 4,600,000 6,300,000 8,100,000
B2HIGH Number of annual transactions per customer Input 6 6 6 6 6
B3HIGH Price per transaction Input $2.25 $2.25 $2.25 $2.25 $2.25
B4HIGH Original percentage of founder charge per transaction Input 20.00% 20.00% 20.00% 20.00% 20.00%
B5HIGH Annual reduction in founder charge per transaction Input 100% 96% 92% 88% 88%
B6HIGH Founder revenue per transaction B4*B5 20.0% 19.2% 18.4% 17.6% 16.8%
AtHIGH Transaction revenue B1*B2*B3*B6 $4,050,000 $7,776,000 $11,426,400 $14,968,800 $18,370,800

Benefit Module 3: Cost Avoidance (High-Level)

Ref. Metric Calc. Year 1 Year 2 Year 3 Year 4 Year 5
C1HIGH CapEx avoided $8,000,000 $8,000,000
C2HIGH Avoided additional infrastructure costs (taxes, transportation, special features and accessories, special testing) C1*30% $2,400,000 $2,400,000
C3HIGH Subtotal: CapEx savings C1+C2 $10,400,000 $10,400,000
C4HIGH Total CapEx costs avoided (cumulative for five years) 20% 20% 20% 20% 20%
C5HIGH OpEx required as a percentage of CapEx C3*C5 $2,080,000 $2,080,000 $2,080,000 $4,160,000 $4,160,000
CtHIGH CapEx and OpEx savings C3+C5 $12,480,000 $2,080,000 $2,080,000 $14,560,000 $4,160,000

Benefit Module 4: Efficiency — Streamlined Documentation (High-Level)

Ref. Metric Calc. Year 1 Year 2 Year 3 Year 4 Year 5
D11,HIGH Total records Input 80,000 80,000 80,000 80,000 80,000
D21,HIGH Percentage of conflicting records 9% 9% 9% 9% 9%
D31,HIGH Number of conflicting records that require resolution D11*D21 7,200 7,200 7,200 7,200 7,200
D41,HIGH Average cost to resolve a dispute Input $300 $300 $300 $300 $300
D51,HIGH Projected reduction in conflicting records with blockchain Input 100% 100% 100% 100% 100%
D61,HIGH Savings due to reduction in conflicting records D31*D41*D51 $2,160,000 $2,160,000 $2,160,000 $2,160,000 $2,160,000
D71,HIGH Average cost for record processing Input $25 $25 $25 $25 $25
D81,HIGH Reduction in cost per record Input 35% 35% 35% 35% 35%
D91,HIGH Savings due to reduction in cost of records processing D11*D71*D81 $700,000 $700,000 $700,000 $700,000 $700,000
Dt1,HIGH Savings for records processing D61+D91 $2,860,000 $2,860,000 $2,860,000 $2,860,000 $2,860,000

Benefit Module 4: Efficiency — Reduced Legacy Systems

Ref. Metric Calc. Year 1 Year 2 Year 3 Year 4 Year 5
D12,HIGH Legacy systems cost Input $250,000 $250,000 $250,000 $250,000 $250,000
D22,HIGH Percentage of legacy systems replaced by IBM Blockchain Input 10% 50% 80% 100% 100%
Dt2,HIGH Legacy systems savings D12*(1-D22) $25,000 $125,000 $200,000 $250,000 $250,000

Number of finance FTEs resolving conflicting records prior to IBM Blockchain

Ref. Metric Calc. Year 1 Year 2 Year 3 Year 4 Year 5
D13,HIGH Number of finance FTEs resolving conflicting records prior to IBM Blockchain Input 6 6 6 6 6
D23,HIGH Finance FTEs annual compensation Input $75,000 $75,000 $75,000 $75,000 $75,000
D33,HIGH Reduction to finance resources dedicated to resolving conflicting records from use of IBM Blockchain Input 20% 40% 60% 80% 80%
D43,HIGH Savings due to reduction in finance FTEs D13*D23*D33 $90,000 $180,000 $270,000 $360,000 $360,000
D53,HIGH Number of legal FTEs resolving conflicting records prior to IBM Blockchain Input 4 4 4 4 4
D63,HIGH Legal FTEs annual compensation Input $200,000 $200,000 $200,000 $200,000 $200,000
D73,HIGH Reduction to legal resources resolving conflicting records with IBM Blockchain Input 0% 30% 50% 70% 70%
D83,HIGH Savings due to reduction in legal FTEs D53*D63*D73 $0 $240,000 $400,000 $560,000 $640,000
Dt3,HIGH Labor cost savings D43+D83 $90,000 $420,000 $670,000 $920,000 $1,000,000

COST MODULES FRAMEWORKS

Cost 1: Pilot Phase Costs Calculation

Ref. Metric Calc. Year 1 Year 2 Year 3 Year 4 Year 5
E1 IBM’s Design Thinking workshop Input
E2 Architectural consultancy Input
E3 Software development fee paid to IBM Input
E4 Number of technical employees involved in pilot Input
E5 Annual fee Input
E6 Percent of internal employees' time spent on the pilot Input
E7 IT/dev/engineering E7 employee monthly compensation Annual compensation/ 12 months
E8 IT/dev/engineering E7 employee monthly compensation E4*E5*E6*E7
E9 Number of employees developing governance model/involved in contract negotiation Input
E10 Percent of internal employees' time spent on the pilot Input
E11 Percent of employees' time spent on the pilot Input
E12 Legal, business owners, IT management annual compensation Annual compensation/ 12 months
E13 Cost of internal governance model/legal pilot efforts E9*E10*E11*E12
Et Cost of pilot E1+E2+E3+E8+E13
Risk adjustment ↑20%
Et Cost of pilot (risk-adjusted)

Cost 2: Commercialization Phase Costs Calculation

Ref. Metric Calc. Year 1 Year 2 Year 3 Year 4 Year 5
F1 IBM Blockchain full development fee to IBM Input
F2 Number of IBM’s Design Thinking workshops Input
F3 IBM’s Design Thinking workshop Input
F4 IBM Blockchain license fee Input
F5 Duration of the engagement (months) Input
F6 Number of employees involved in development internally Input
F7 Percent of internal employees' time dedicated to commercialization effort Input
F8 IT/dev/engineering employee monthly compensation Annual compensation/ 12 months
F9 Cost of internal IT/developers' commercialization efforts F5*F6*F7*F8
F10 Number of employees developing governance model/involved in contract negotiation Input
F11 Duration of the governance model development and contract negotiation (months) Input
F12 Percent of employees' time spent on the pilot Input
F13 Legal, business owners, IT management annual compensation Annual compensation/ 12 months
F14 Cost of internal governance model/legal commercialization efforts F10*F11*F12 *F13
F15 Number of blockchain members onboarded for commercialization Input
F16 Cost of onboarding one member (including marketing, admin, contract negotiation) Input
F17 Cost of member onboarding F15*F16
Ft Cost of pilot F1+F2*F3+F4
+F9+F14+F17
Risk adjustment ↑20%
Ftr Commercialized blockchain development (risk-adjusted)

Cost 3: Ongoing Blockchain Management Costs Calculation

Ref. Metric Calc. Year 1 Year 2 Year 3 Year 4 Year 5
G1 IBM Blockchain license fee Input
G2 Continued IBM Blockchain software development fee Input
G3 Internal IT/developer resources to maintain blockchain Input
G4 Percent of time to maintain blockchain Input
G5 IT/dev/engineering employee annual compensation Input
G6 Cost of internal IT/dev/engineering resources to run blockchain G3*G4*G5
G7 Number of employees developing governance model/involved in contract negotiation Input
G8 Percent of employees' time spent on the governance model ongoing support Input
G9 Legal, business owners, IT management annual compensation Input
G10 Cost of internal governance model/legal commercialization efforts Input
G11 Number of blockchain members onboarded for commercialization Input
G12 Cost of onboarding one member (including marketing, admin, contract negotiation) Input
G13 Cost of member onboarding G11*G12
G14 Ecosystem development (workshops, community boards, other) Input
Gt Blockchain ongoing management G1+G2*G6+G10
+G13+G14
Risk adjustment ↑20%
Gtr Blockchain ongoing management (risk-adjusted)

Membership Revenue: Sample Calculation (Low)

Membership Revenue: Sample Calculation (Low)

Ref. Metric Calc. Year 1 Year 2 Year 3 Year 4 Year 5
A1SAMPLE,LOW New members Input 12 12 12 12 12
A2SAMPLE,LOW Onboarding fee Input $5,000 $5,000 $5,000 $5,000 $5,000
A3SAMPLE,LOW Annual membership churn Input 0% 0% 0% 0% 0%
A4SAMPLE,LOW Total members (A4prior+A1current) *(1-A3) 12 24 36 48 60
A5SAMPLE,LOW Annual fee Input $10,000 $10,000 $10,000 $10,000 $10,000
AtSAMPLE,LOW Membership revenue A1*A2*A4*A5 $180K $300K $420K $540K $660K

Transaction Revenue: Sample Calculation (Low)

Ref. Metric Calc. Year 1 Year 2 Year 3 Year 4 Year 5
B1SAMPLE,LOW Number of customers Input 1,500,000 2,500,000 3,500,000 4,500,000 5,500,000
B2SAMPLE,LOW Number of annual transactions per customer Input 2 2 2 2 2
B3SAMPLE,LOW Price per transaction Input $1.75 $1.75 $1.75 $1.75 $1.75
B4SAMPLE,LOW Original percentage of founder charge per transaction Input 18% 18% 18% 18% 18%
B5SAMPLE,LOW Decrease in founder revenue per transaction with customer base expansion Input 100% 97% 94% 91% 88%
B6SAMPLE,LOW Founder revenue per transaction Input 18.00% 17.46% 16.92%% 16.38% 15.84%
BtSAMPLE,LOW Transaction revenue B1*B2* B3*B6 $945K $1.5M $2.0M $2.6M $3.0M

SAMPLE ORGANIZATION CALCULATIONS: BENEFITS CALCULATIONS (MID-RANGE PROJECTION)

Membership Revenue: Sample Calculation (Mid-Range)

Ref. Metric Calc. Year 1 Year 2 Year 3 Year 4 Year 5
A1SAMPLE,MID New members Input 12 12 12 12 12
A2SAMPLE,MID Onboarding fee Input $6,000 $6,000 $6,000 $6,000 $6,000
A3SAMPLE,MID Annual membership churn Input 0% 0% 0% 0% 0%
A4SAMPLE,MID Total members (A4prior+A1current) *(1-A3) 12 24 36 48 60
A5SAMPLE,MID Annual fee Input $12,000 $12,000 $12,000 $12,000 $12,000
AtSAMPLE,MID Membership revenue A1*A2*A4*A5 $216K $360K $504K $648K $792K

Transaction Revenue: Sample Calculation (Mid-Range)

Ref. Metric Calc. Year 1 Year 2 Year 3 Year 4 Year 5
B1SAMPLE,MID Number of customers Input 1,500,000 3,000,000 4,500,000 6,000,000 7,500,000
B2SAMPLE,MID Number of annual transactions per customer Input 4 4 4 4 4
B3SAMPLE,MID Price per transaction Input $2.00 $2.00 $2.00 $2.00 $2.00
B4SAMPLE,MID Original percentage of founder charge per transaction Input 19% 19% 19% 19% 19%
B5SAMPLE,MID Decrease in founder revenue per transaction Input 100% 97% 94% 91% 88%
B6SAMPLE,MID Founder revenue per expansion transaction Input 19.00% 18.43% 17.86%% 17.29% 16.72%
BtSAMPLE,LOW Transaction revenue B1*B2* B3*B6 $2.3M $4.4M $6.4M $8.3M $10.0M

SAMPLE ORGANIZATION CALCULATIONS: BENEFITS CALCULATIONS (HIGH-LEVEL PROJECTION)

Membership Revenue: Sample Calculation (High-Level)

Ref. Metric Calc. Year 1 Year 2 Year 3 Year 4 Year 5
A1SAMPLE,HIGH New members Input 12 12 12 12 12
A2SAMPLE,HIGH Onboarding fee Input $7,500 $7,500 $7,500 $7,500 $7,500
A3SAMPLE,HIGH Annual membership churn Input 0% 0% 0% 0% 0%
A4SAMPLE,HIGH Total members (A4prior+A1current) *(1-A3) 12 24 36 48 60
A5SAMPLE,HIGH Annual fee Input $15,000 $15,000 $15,000 $15,000 $15,000
AtSAMPLE,HIGH Membership revenue A1*A2*A4*A5 $270K $450K $630K $810K $990K

Transaction Revenue: Sample Calculation (High-Level)

Ref. Metric Calc. Year 1 Year 2 Year 3 Year 4 Year 5
B1SAMPLE,HIGH Number of customers Input 1,500,000 3,000,000 4,600,000 6,300,000 8,100,000
B2SAMPLE,HIGH Number of annual transactions per customer Input 6 6 6 6 6
B3SAMPLE,MID Price per transaction Input $2.25 $2.25 $2.25 $2.25 $2.25
B4SAMPLE,HIGH Original percentage of founder charge per transaction Input 20% 20% 20% 20% 20%
B5SAMPLE,HIGH Decrease in founder revenue per transaction Input 100% 96% 92% 88% 84%
B6SAMPLE,HIGH Founder revenue per expansion transaction Input 20.00% 19.20% 18.40%% 17.60% 16.80%
BtSAMPLE,HIGH Transaction revenue B1*B2* B3*B6 $4.1M $7.8M $11.4M $15.0M $18.4M

SAMPLE ORGANIZATION CALCULATIONS: DETAILED COST CALCULATIONS

Cost 1: Pilot Phase Costs Calculation

Ref. Metric Calc. INITIAL Year 1 Year 2 Year 3 Year 4 Year 5
E1SAMPLE IBM’s Design Thinking workshop IBM $32,000
E2SAMPLE Architectural consultancy IBM $14,000
E3SAMPLE Software development fee paid to IBM IBM/ Interviews $250,000
E4SAMPLE Number of technical employees involved in pilot Interview 5
E5SAMPLE Duration of the engagement (months) Interview 6
E6SAMPLE Percent of internal employees' time spent on the pilot Interview 15%
E7SAMPLE IT/dev/engineering employee monthly compensation $150,000/ 12 months $12,500
E8SAMPLE Cost of internal IT/ developers' pilot efforts E4*E5*E6*E7 $56,250
E9SAMPLE Number of employees developing governance model/involved in contract negotiation Interview 2
E10SAMPLE Duration of the governance model development and contract negotiation (months) Interview 6
E11SAMPLE Percent of employees' time spent on the pilot Interview 20%
E12SAMPLE Legal, business owners, IT management annual compensation $200,000/ 12 months $16,667
E13SAMPLE Cost of internal governance model/ legal pilot efforts E9*E10*E11*E12 $40,000.80
EtSAMPLE Cost of pilot E1+E2+E3+E8+E13 $392,256 $0 $0 $0 $0 $0
Risk adjustment ↑20%
EtSAMPLE Cost of pilot (risk-adjusted) $470,707 $0 $0 $0 $0 $0

Cost 2: Commercialization Phase Costs — Sample Calculation

Ref. Metric Calc. INITIAL Year 1 Year 2 Year 3
F1SAMPLE IBM Blockchain full development fee Interview $1,500,000
F2SAMPLE Number of IBM’s Design Thinking workshops Interview 2
F3SAMPLE IBM’s Design Thinking workshop IBM $32,000
F4SAMPLE IBM Blockchain license fee IBM $20,000
F5SAMPLE Duration of the engagement (months) Interview 12
F6SAMPLE Number of internal employees involved Interview 5
F7SAMPLE Percent of time dedicated to commercialization effort Interview 15%
F8SAMPLE IT/dev/engineering employee monthly compensation $150,000/ 12 months $12,500
F9SAMPLE Cost of internal IT/developers' commercialization efforts F5*F6*F7*F8 $112,500
F10SAMPLE Number of employees developing governance model/involved in contract negotiation 3
F11SAMPLE Duration of the governance model development and contract negotiation (months) 12
F12SAMPLE Percent of employees' time spent on the pilot 20%
F13SAMPLE Legal, business owners, IT management annual compensation $200,000/ 12 months $16,667
F14SAMPLE Cost of internal governance model/legal commercialization efforts F10*F11*F12 *F13 $120,002
F15SAMPLE Number of blockchain members onboarded for commercialization 3
F16SAMPLE Cost of onboarding one member $5,000
F17SAMPLE Cost of member onboarding $15,000
FtSAMPLE Commercialized blockchain development F1+F2*F3+F4 +F9+F14+F17 $1,831,502 $0 $0 $0
Risk adjustment ↑20%
FtSAMPLE Commercialized blockchain development (risk-adjusted) $2,197,803 $0 $0 $0

Cost 3: Ongoing Blockchain Management Costs — Sample Calculation

Ref. Metric Calc. INITIAL Year 1 Year 2 Year 3 Year 4 Year 5
G1SAMPLE IBM Blockchain license fee Input $20,000 $20,000 $20,000 $20,000 $20,000
G2SAMPLE Continued IBM blockchain software development fee Input $200,000 $200,000 $200,000 $200,000 $200,000
G3SAMPLE Internal IT/developer resources to maintain blockchain Input 3 3 3 3 3
G4SAMPLE Percent of time to maintain Blockchain Input 20% 20% 20% 20% 20%
G5SAMPLE IT/dev/engineering employee annual compensation Input $150,000 $150,000 $150,000 $150,000 $150,000
G6SAMPLE Cost of internal IT/dev/engineering resources to run blockchain G3*G4*G5 $90,000 $90,000 $90,000 $90,000 $90,000
G7SAMPLE Number of employees developing governance model/involved in contract negotiation Input 1 1 1 1 1
G8SAMPLE Percent of employees' time spent on the governance model ongoing support Input 100% 100% 100% 100% 100%
G9SAMPLE Legal, business owners, IT management annual compensation Input $200,000 $200,000 $200,000 $200,000 $200,000
G10SAMPLE Cost of internal governance model/ legal commercialization efforts G7*G8*G9 $200,000 $200,000 $200,000 $200,000 $200,000
G11SAMPLE Number of blockchain members onboarded for commercialization Input 12 12 12 12 12
G12SAMPLE Cost of onboarding one member (including marketing, admin, contract negotiation) Input $5,000 $5,000 $5,000 $5,000 $5,000
G13SAMPLE Cost of member onboarding G11*G12 $60,000 $60,000 $60,000 $60,000 $60,000
G14SAMPLE Ecosystem development (workshops, community boards, other) Input $200,000 $200,000 $200,000 $200,000 $200,000
G15SAMPLE Blockchain ongoing management G1+G2+G6+G10
+G13+G14
$770,000 $770,000 $770,000 $770,000 $770,000
Risk adjustment ↑20%
GtSAMPLE Blockchain ongoing management (risk-adjusted) $0 $924K $924K $924K $924K $924K