July 2022

The Partner Opportunity For Azure Services Providers

A Total Economic Impact™ Partner Opportunity Analysis

Microsoft Azure continues to command significant market share as the second-largest cloud hyperscaler. As the ubiquity of Azure grows, so does the need and opportunity to provide support for maximizing investments in Azure implementation. Leveraging Azure services partners can help organizations drive “better overall governance of [their] Azure implementation, accelerate [their] Azure strategy, achieve benefits at scale, and address requirements for Azure skills.”1

Between the pandemic-induced rush to remote working and organic growth in cloud adoption, the past few years have seen the rapid evolution of an already booming industry. Organizations are increasingly either born in the cloud or taking a cloud-centric approach to modernize their business. Subsequently, Microsoft Azure services partners are seeing rising demand for their expertise as their clientele’s Azure journeys become more advanced and they require more support to fully maximize the benefits of Azure. Furthermore, partners are changing the way in which they work with clients, providing more flexibility in their deal structures and placing greater focus on desired business outcomes to better meet the specific needs of each customer.

Microsoft commissioned Forrester Consulting to conduct a Total Economic Impact™ (TEI) study to examine the potential business opportunity and return on investment (ROI) partners may realize by building and scaling a Microsoft Azure services practice.2 The purpose of this study is to provide potential and existing partners with a framework to evaluate the potential business opportunity associated with building an Azure services practice by delivering professional services and managed services and offering Azure consumption resell and business support as part of the Microsoft partner ecosystem.

icon
Year 3 practice-wide gross margin:
45%

To better understand the revenue streams, investments, and risks associated with an Azure services practice, Forrester interviewed fourteen representatives of existing Azure services partners with experience delivering professional and managed services around Azure. To illustrate the financial impact and subsequent partner business opportunity for Azure services partners, Forrester aggregated the characteristics of these interviewees and combined the results into a single composite organization. The composite organization is based in the US with global operations. It also offers a broad portfolio of services around Azure to its customers — including both professional and managed services.

Consulting Team:
  • Mbenoye Diagne, David Park

Key Findings

  • icon
    ROI
    155%
  • icon
    Gross Margin
    45%
  • icon
    Operating Margin
    31%
  • icon
    Net present value (NPV)
    $41.05M

Key Findings

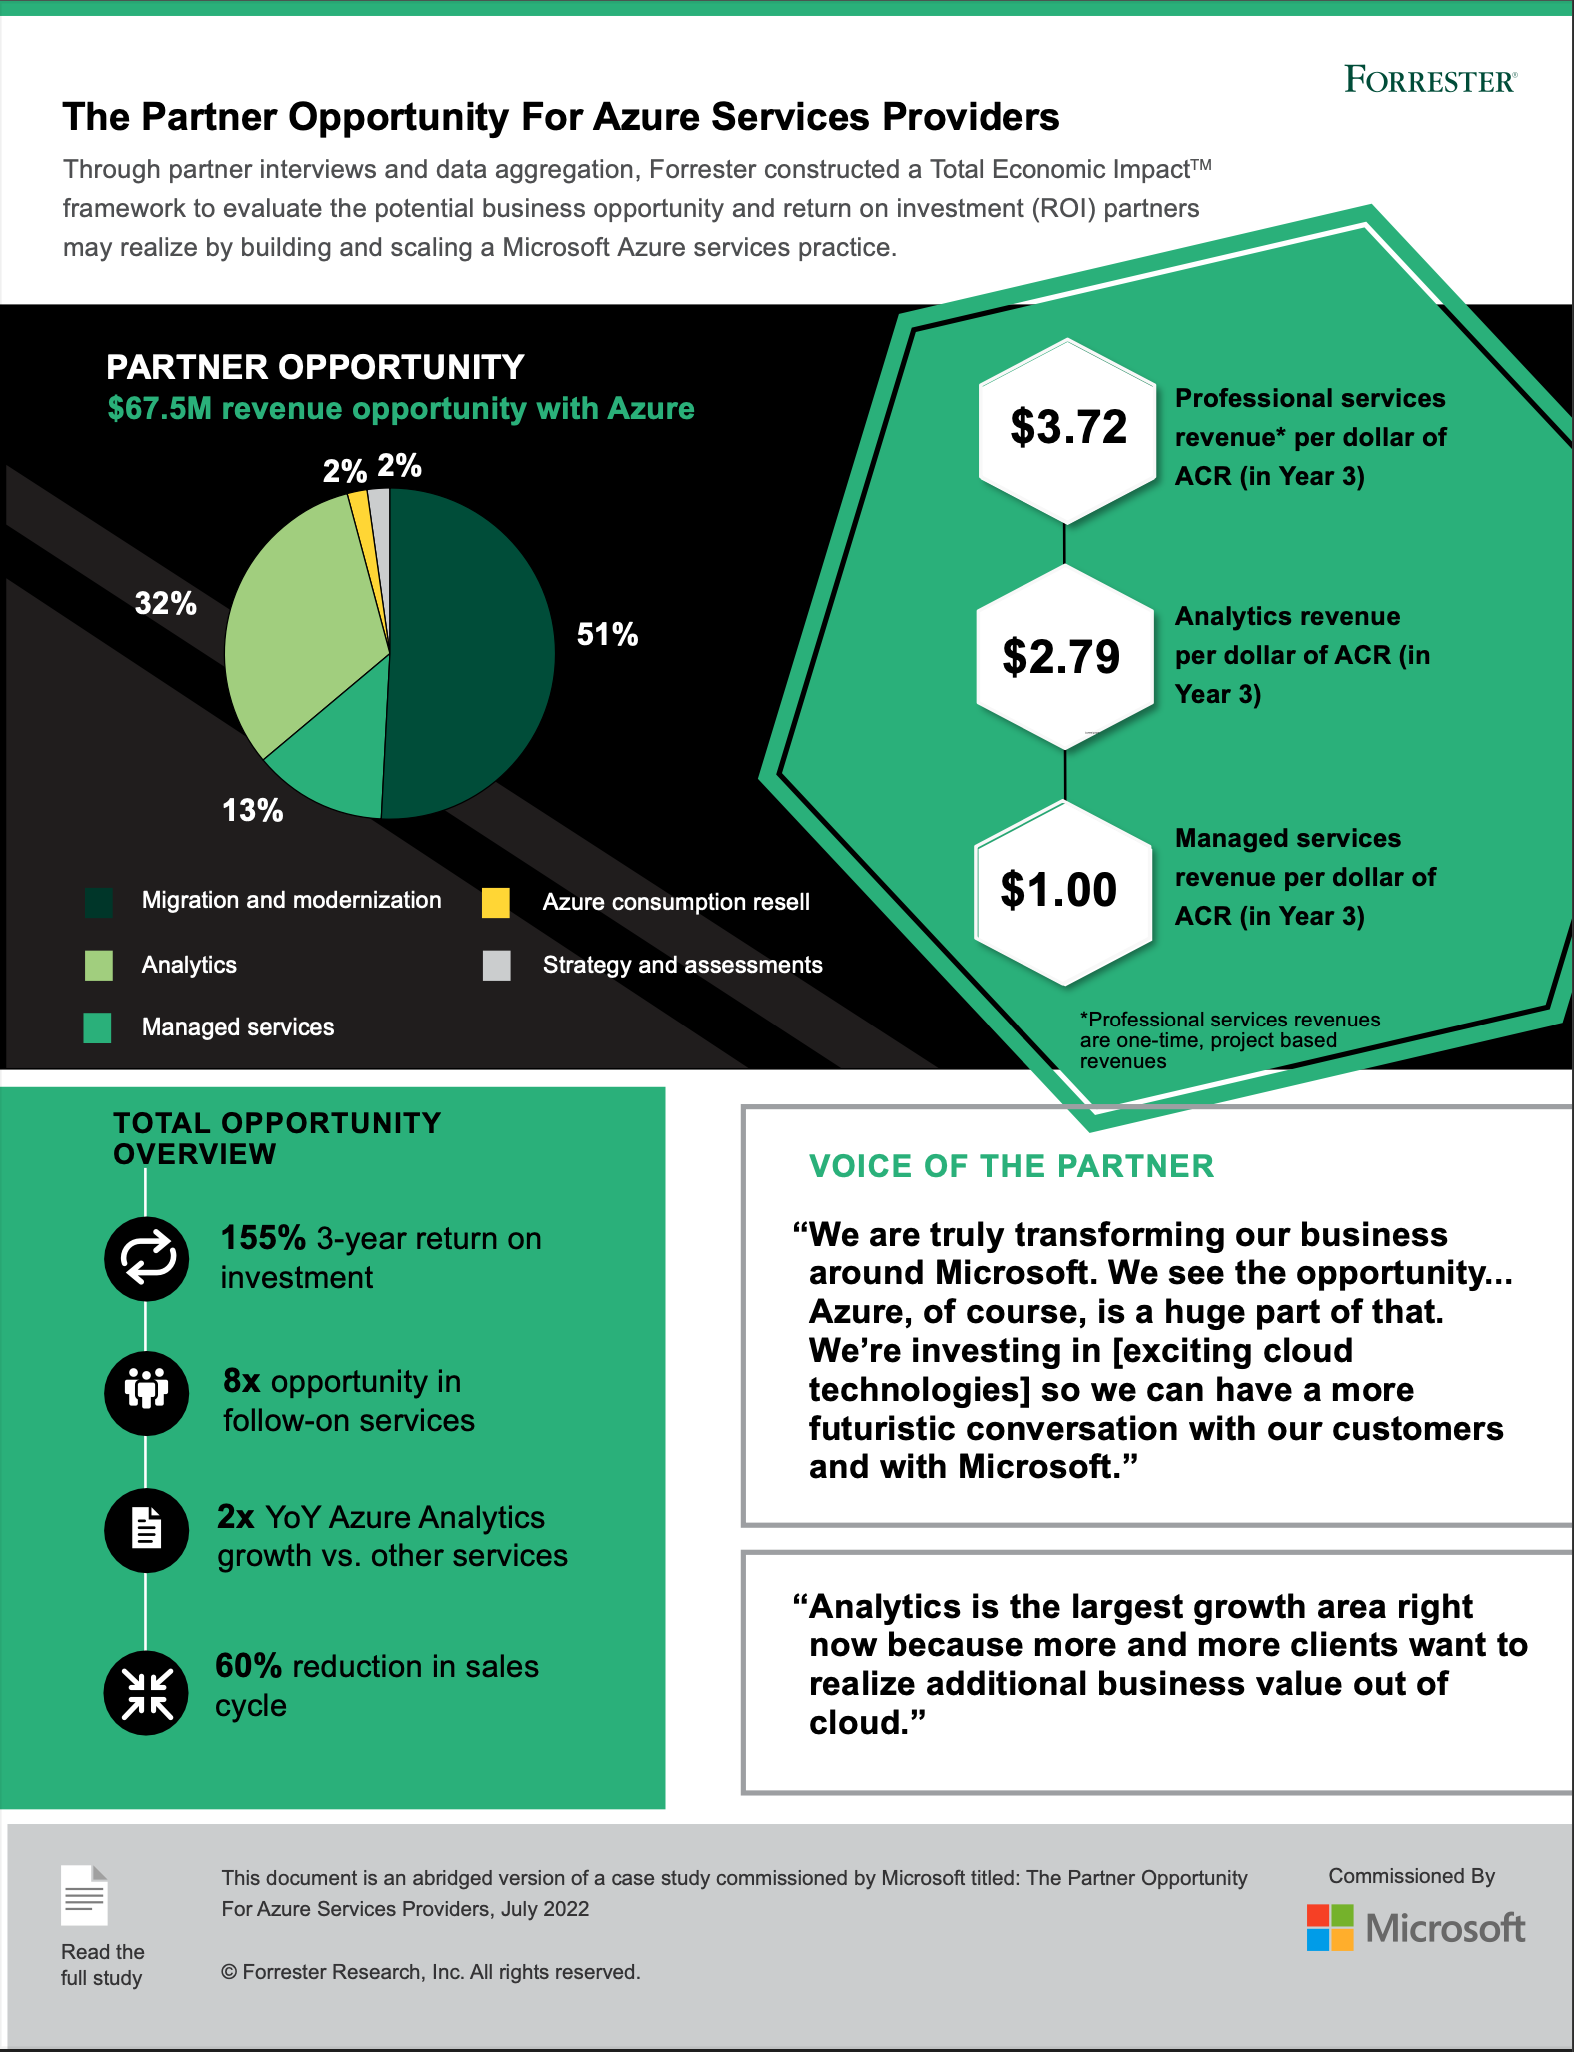
Revenue opportunities. The composite partner organization captures the following revenue streams, which are representative of those experienced by interviewees’ organizations:

  • Azure strategy and assessments.

    Strategy and assessment work sets the foundation for preliminary opportunities and ongoing partner-client relationships. Although some partners are now forgoing this step when clients understand their needs, most of the composite organization’s clients continue to complete assessments. In Forrester’s three-year analysis, Azure strategy and assessment work made up 2% of the composite partner organization's total gross profits.

  • Azure migration and modernization.

    Partners offer professional services including migration, modernization, and application development to help clients take advantage of Azure. In the past, most partners viewed these services as separate, sequential work units. Now they are taking more flexible, outcomes-centric approaches to these workloads to match the mindsets and needs of their clients. In Forrester’s three-year analysis, Azure migration and modernization work totaled 51% of the composite partner organization's total gross profits

  • Azure managed services.

    Beyond professional services work like migration and modernization, partners often offer managed services to their clients to maximize the benefits of their Azure environment on an ongoing basis. Partners are increasingly tailoring their managed services offerings to fluidly meet the business outcomes clients desire. In Forrester’s three-year analysis, Azure managed services work comprised 13% of the composite partner organization's total gross profits.

  • Azure analytics services.

    Azure analytics is the newest and fastest growing revenue stream in the Azure services partner opportunity. Analytics work is focused on helping customers extract value from their data through modernization activities and building data integrations into other technologies. In Forrester’s three-year analysis, Azure analytics work made up 32% of the composite partner organization's total gross profits.

  • Azure consumption resell and business support.

    Partners resell Azure consumption as an additional revenue stream, allowing them to further entrench themselves into their clients' Azure experience. This reselling allows partners to better manage, support, and improve the partner-client relationship and drive more Azure professional and managed service deals. In Forrester’s three-year analysis, Azure consumption resell and business support work totaled 2% of the composite partner organization's total gross profits.

Investments. Beyond direct service delivery costs (including base compensation and corporate overhead expenses for delivery resources), which are embedded in the gross margin calculations of each revenue stream, partners also invested in:

  • Talent acquisition and hiring.

    The composite partner commits to serving their clients well by investing in a talented, capable team. Over Forrester’s three-year analysis, talent acquisition and hiring expenses made up 5.35% of the composite partner organization’s total Azure practice investments.

  • Research and development (R&D).

    The composite partner invests in developing custom tools, scripts, templates, and processes not only before partnering with Microsoft, but after launching its practice to continue improving and offering new services and solutions. Over Forrester’s three-year analysis, research and development expenses totaled 10.45% of the composite partner organization’s total Azure practice investments.

  • Training.

    To achieve practice-level competencies and improve Azure service delivery, the composite partner invests in Microsoft training courses and internal training programs. Over our three-year analysis, training expenses amounted to 3.97% of the composite partner organization’s total Azure practice investments.

  • Sales and marketing.

    Spend on sales and marketing leads to new clients and service deals for the composite partner. Over Forrester’s three-year analysis, sales and marketing expenses accrued to 66.86% of the composite partner organization’s total Azure practice investments.

  • General and administrative (G&A) expenses.

    The composite partner has standard expenses related to its offices, utilities, and back-office functions. Over Forrester’s three-year analysis, research and development expenses made up 13.37% of the composite partner organization’s total Azure practice investments.

The representative interviews and financial analysis found that a composite partner organization experiences total present value (PV) gross profits of $67.57 million over three years versus investments and overhead expenses of $26.52 million, adding up to a net present value (NPV) of $41.05 million and an ROI of 155%.

Azure Services Partner Pro Forma Revenue And Margin Opportunity: Three-Year Analysis (USD)

Ref. Metric Source Initial Year 1 Year 2 Year 3
PL1 Azure professional services revenues At+Bt $22,425,000 $33,247,500 $49,343,775
PL2 Azure managed services revenues CT $2,160,000 $5,760,000 $13,320,000
PL3 Azure analytics services revenues Dt $12,000,000 $21,060,000 $36,960,300
PL4 Azure consumption resell revenues Et $15,000,000 $15,300,000 $15,606,000
PL5 Total revenue PL1+PL2+PL3+PL4 $37,275,000 $60,771,300 $100,341,951
PL6 Total gross profit At+Bt+Ct $15,131,813 $26,034,866 $45,209,694
PL7 Total gross margin PL6/PL5 41% 43% 45%
PL8 Talent acquisition and hiring expenses F2 $0 $298,200 $486,170 $802,736
PL9 Research and development expenses F3 $1,118,250 $372,750 $607,713 $1,003,420
PL10 Training expenses F4 $186,375 $186,375 $303,857 $501,710
PL11 Sales and marketing expenses F5 $0 $3,727,500 $6,077,130 $10,034,195
PL12 General and administrative expenses F6 $0 $745,500 $1,215,426 $2,006,839
PL13 Total operating expenses PL8+PL9+ PL10+PL11+PL12 $1,304,625 $5,330,325 $8,690,296 $14,348,899
PL14 Operating income PL6-PL13 -$1,304,625 $9,801,488 $17,344,570 $30,860,795
PL15 Operating margin PL14/PL5 26% 29% 31%

Benefits (Three-Year)


TEI Framework And Methodology

From the information provided in the interviews, Forrester constructed a Total Economic Impact™ framework for those partners considering building and growing a Microsoft Azure services practice.

The objective of the framework is to identify the revenue streams, investments, flexibility, and risk factors that affect the investment decision. Forrester took a multistep approach to evaluate the holistic opportunity for partners building and growing a Microsoft Azure services practice.

  • icon
    DUE DILIGENCE

    Interviewed Microsoft stakeholders and Forrester analysts to gather data relative to Azure services.

  • icon
    INTERVIEWS

    Interviewed fourteen representatives at partner organizations with existing Azure services practices to obtain data with respect to costs, benefits, and risks.

  • icon
    COMPOSITE ORGANIZATION

    Designed a composite partner organization based on characteristics of the interviewees’ organizations.

  • icon
    FINANCIAL MODEL FRAMEWORK

    Constructed a financial model representative of the interviews using the TEI methodology and risk-adjusted the financial model based on issues and concerns of the interviewees.

  • icon
    CASE STUDY

    Employed four fundamental elements of TEI in modeling the impact of an Azure services practice: revenue, investments, flexibility, and risks. Given the increasing sophistication of ROI analyses related to IT investments, Forrester’s TEI methodology provides a complete picture of the total economic impact of investment and partnership decisions. Please see Appendix A for additional information on the TEI methodology.

DISCLOSURES

Readers should be aware of the following:

This study is commissioned by Microsoft and delivered by Forrester Consulting. It is not meant to be used as a competitive analysis.

Forrester makes no assumptions as to the potential ROI that other organizations will receive. Forrester strongly advises that readers use their own estimates within the framework provided in the study to determine the appropriateness of an investment in an Azure services practice.

Microsoft reviewed and provided feedback to Forrester, but Forrester maintains editorial control over the study and its findings and does not accept changes to the study that contradict Forrester’s findings or obscure the meaning of the study.

Microsoft provided the partner names for the interviews but did not participate in the interviews.

Partner Goals, Challenges, And Drivers

The interviewees’ partner organizations were diverse in size, background, functional and vertical specializations, type, and degree of engagement with Microsoft. They partnered with Microsoft to build and scale their Azure services businesses for a myriad of reasons, including:

  • More innovation across the cloud landscape than ever.

    As organizations become more cloud-centric and the number of born-in-the-cloud companies steadily grows, digital transformation journeys continue to become more complex and call for more advanced components such as specialized managed services and analytics. This is all in the pursuit of becoming more progressive and proactive organizations, driven by data-backed insights. Customers expect partners to be up to date on the latest and greatest competencies and drive their transformations end-to-end.

  • Shift in buyer mindset and customer requirements due to increased cloud maturity.

    In a world where cloud computing is more of a norm than an exception, businesses and enterprises are increasingly mature in their cloud journeys and thus empowered to focus on business outcomes rather than the technology behind them. Additionally, business buyers are increasingly prevalent in this space when it was typically dominated by IT decision-makers in the past. These dynamics, among others, culminate in a shift in customer requirements as the buyers’ priorities mature and transform.

  • Evolution of Azure services deal characteristics.

    Given the shift in buyer foci and the continued evolution of the cloud landscape, the anatomy of a deal for a partner has changed greatly as well. In the past, there was a typical journey with prescribed stages into which customers fell. Partners would then simply start working from wherever the customer currently was along that path. Now, there is no more typical; partners are still meeting customers where they are, but more in relation to needs tied to specific business outcomes and less so based on any formally established stage of their cloud journey.

Shaping A Successful Azure Practice

Considering these drivers, successful partners made strategic decisions around the types of practice-level investments made, services offered, and go-to-market approaches used to ensure continued growth of their Azure practices. Interviewees shared the following best practices from their organizations:

  • Starting conversations around specific client goals and desired business outcomes.

    Adapting to the shift in buyer focus from technology to outcomes, the preliminary conversations between partners and their customers have shifted to a more strategic tone. Partners are focused on delivering whatever work is needed to help customers achieve their business goals, launching a campaign that is specifically tailored to a client’s needs and not just following a one-size-fits-all cloud journey.

  • Staying involved in the entire customer engagement lifecycle via land-and-expand strategies.

    Expanding upon the concept of more strategic positioning, partners recognize great value in being a one-stop shop for all their client’s Azure services needs. Furthermore, they are willing to start small with lower-value deals at the outset in the interest of landing and expanding and ultimately becoming more deeply embedded with their customers.

  • Being aware of emergent technology and capitalizing on it.

    Partners are staying abreast of and leaning into emergent trends in cloud strategy. Analytics is just one example of a new and booming revenue stream born out of keeping up with what’s new and now. Often, Microsoft is evangelizing these trends and building out solutions to address them, with partners following suit and creating competencies to support their customers in these spaces.

Composite Organization

Based on the interviews, Forrester constructed a TEI framework, a composite partner company, and an ROI analysis that illustrates the areas financially affected. The composite organization is representative of the 14 interviewees, and it is used to present the aggregate financial analysis in the next section. The composite organization has the following characteristics:

  • Operates globally with headquarters based in the US.
  • Offers its customers a broad portfolio of services around Azure, including a range of both professional services and managed services.
  • Total Azure practice revenues started at $10.8 million in Year 1 and grew to over $33.7 million in Year 3 through organic and expansion and incremental margin improvement. The partner completed 30 unique Azure projects made up of various components in Year 1, and this grew organically by 30% year-over-year, resulting in 51 projects in Year 3.
Key assumptions
  • Year 1 to Year 3 revenues: $10.8M to $33.7M
  • Year 1 to Year 3 project count: 30 to 51
  • 230% year on year organic growth

Revenue Streams And Gross Profits

Ref. Benefit Year 1 Year 2 Year 3 Total Present Value
Atr Strategy and assessments $473,813 $615,956 $800,743 $1,890,512 $1,541,404
Btr Migration and modernization $7,980,000 $13,123,110 $21,580,954 $42,684,064 $34,314,181
Ctr Managed services $1,128,600 $3,009,600 $6,959,700 $11,097,900 $8,742,198
Dtr Analytics $4,560,000 $8,002,800 $14,044,914 $26,607,714 $21,311,491
Etr Azure consumption resell $655,500 $668,610 $681,982 $2,006,092 $1,660,863
Total gross profit (risk- adjusted) $14,797,913 $25,420,076 $44,068,294 $84,286,282 $67,570,137
“We are increasingly feeling compelled to start the conversation from the right side of the continuum, centering around business outcomes, business models, and innovation.”

Strategy And Assessments

  • Evidence and data.

    Strategy and assessment work continues to serve as a critical foundation for interviewees’ partner organizations to win downstream engagements with their clients. This work consists of planning workshops and technical assessments and involves documenting the customer’s goals from both the business and IT user perspectives, analyzing the existing infrastructure and workloads in place, and building a roadmap for the recommended course of action based on the client’s budget and time constraints. These roadmaps naturally set the stage for follow-on work that furthers the client’s efforts towards the initiative at-hand as well as other related business goals.

    • An increasing number of partners are not seeing 100% of their clients go through assessment, whereas this work was a given in the past. In such scenarios, clients can clearly define their needs and where things currently stand, so the partner completes an upfront analysis to form a roadmap but bypasses assessment.
    • Across interviewees, deal sizes ranged from $10,000 on the low end to $200,000 on the high end, depending on the size, deployment characteristics, and complexity of the customer’s environment. Costs also depend on the resources and time the partner organization needs to deliver the engagement on its side.
    • Interviewees reported gross margins ranging from 30% to 40%. Multiple interviewees also said that Microsoft funds the execution of a lot of their organizations’ strategy and assessment work through channels like the Solution Assessment Program, resulting in more favorable margins. Several partners create their own intellectual property (IP) to automate and scale the assessment phase, further increasing these margins.
  • Modeling and assumptions.

    For the composite partner organization, Forrester assumes that:

    • Ninety-five percent of projects include a strategy and assessment component that resulted in direct revenue.
    • The average deal size per strategy and assessment engagement is $50,000.
    • Average strategy and assessment gross margins are 35%.
  • Risks.

    The following factors may impact other partners’ realization of this benefit category:

    • The organization’s pricing models (e.g., fixed vs. variable).
    • Competitive pressures.
    • The degree to which processes can be automated.
    • Whether or not a partner chooses to partially or entirely absorb the cost of strategy and assessment work as a presales activity to enable other, more profitable Azure services.
  • Results.

    To account for these risks, Forrester adjusted this revenue stream downward by 5%, yielding a three-year, risk-adjusted total PV gross profits (discounted at 10%) of $1.54 million.

Strategy And Assessments

Ref. Metric Source Year 1 Year 2 Year 3
A1 Number of Azure projects completed Composite 30 39 51
A2 Percentage of projects with strategy and assessment component Interviews 95% 95% 95%
A3 Number of strategy sessions and planning assessments completed A1*A2 29 37 48
A4 Average strategy and assessment deal size Interviews $50,000 $50,000 $50,000
A5 Total strategy and assessment revenues A3*A4 $1,425,000 $1,852,500 $2,408,250
A6 Average strategy and assessment gross margin Interviews 35% 35% 35%
At Strategy and assessments A5*A6 $498,750 $648,375 $842,888
Risk adjustment ↓5%
Atr Strategy and assessments (risk-adjusted) $473,813 $615,956 $800,743
Three-year total: $1,890,512 Three-year present value: $1,541,404
“It’s almost collective where you’re getting the migration and the modernization all in one piece along with some of the applications.”

Migration And Modernization

  • Evidence and data.

    Migration involves the lift and shift of workloads to infrastructure as a service (IaaS) and building proof of concepts to enable certain benefits. While organizations can achieve some results immediately with standard IaaS, they might find that some workloads require a cloud-based development platform, or platform-as-a-service (PaaS) offering, to maximize the benefits of Azure. To continue using critical legacy applications and avoid building new applications on Azure, applications need to be modernized to enable the PaaS framework; such motions are known as modernization or refactoring and rearchitecting work. For some workloads, there is a need to develop applications natively on Azure, either because they would be too costly to modernize or because they must be built specifically for Azure to enable the full benefits of certain use cases (e.g., artificial intelligence and/or machine learning).

    Traditionally, partners have viewed migration execution, modernization efforts, and cloud-native application development work as distinct categories that were sequential in nature. For example, a customer would not just show up ready to modernize; they would first need to migrate. Now, partners are increasingly taking a more outcomes-centric approach, modeling the mindset of their customers. As a result, they are seeing more clients lead with modernization efforts. Migration is viewed as inherent and not necessarily having to be the first step of a client’s journey with a partner. Furthermore, custom new application development is less of a focus area than it has been in the past due to high cost and recent surge in infrastructural updates to enable remote work. Instead of creating custom applications from scratch, partners are increasingly leveraging and customizing first-party and third-party applications, allowing for more scalable projects and improved margins.

    Given this new paradigm, migration, modernization, and custom application development are one aggregate category in this year’s analysis. Interviewees from partner organizations shared the following about how they are seeing this opportunity area evolve:

    • Interviewees with partner organizations are no longer married to a specific sequence of events for all customers. They primarily focus on serving a client’s needs, and then proceed accordingly. One interviewee stated: “It all depends on the organization and its application development strategy. If it’s a more traditional company, it’ll be in the space of migrate, manage, then modernize. If it’s more of an innovative SaaS provider, they really want to commit to modernization right away, so we’ll go straight from on-prem to modernization and managed services.”
    • Despite the shift in sequencing of customer journeys, there is still a lot of opportunity out there for migration work. However, it is generally understood amongst partners that migration is now a means to an end rather than the end all be all. One interviewee shared: “Now, migration is a byproduct of digital transformation, whereas three years ago customers were just rushing to get to the cloud. The conversation has shifted because either many of the workloads have already moved over or those that haven’t moved over will get migrated as a byproduct of a customer thinking about more of a business-oriented outcome.”
    • Regardless of whether migrations are executed before or after modernization, the migration itself can set partners up nicely for a continuous stream of modernization revenue with each customer. One interviewed systems integrator said: “Even if they do the work before, they always have to do the work after as well and that’s something that customers are starting to understand. Now, there’s loads more cloud services that have come out that can be optimized and squeezed a lot more. We are starting to see our very, very advanced customers thinking about this on a continuous basis where they’re really pushing in so they can breathe out again.”
  • Modeling and assumptions.

    For the composite partner organization, Forrester assumes that:

    • Seventy percent of projects include a migration and modernization component in Year 1. This grows by 15% year-over-year as partners monopolize green space in their respective markets, so 93% of projects include some form of migration, modernization, and/or custom app development in Year 3.
    • The average deal size of migration and modernization work is $1 million.
    • Average migration and modernization gross margins are 40% in Year 1 and grow 10% year-over-year to 48% in Year 3. This is due to efficiency gains from continued training and experience of delivery teams.
  • Risks.

    The following factors may impact other partners’ realization of this benefit category:

    • Pricing and project characteristics unique to each practice.
    • Individual skill sets and training of the delivery team.
  • Results.

    To account for these risks, Forrester adjusted this revenue stream downward by 5%, yielding a three-year, risk-adjusted total PV gross profit of $34.3 million.

Migration And Modernization

Ref. Metric Source Year 1 Year 2 Year 3
B1 Number of Azure projects completed Composite 30 39 51
B2 Percentage of projects with migration and modernization component Interviews 70% 81% 93%
B3 Number of migration and modernization deals completed B1*B2 21 31 47
B4 Average migration and modernization deal size Interviews $1,000,000 $1,000,000 $1,000,000
B5 Total migration and modernization revenues B4*B5 $21,000,000 $31,395,000 $46,935,525
B6 Average gross margin for migration and modernization deals Interviews 40% 44% 48%
Bt Migration and modernization B5*B6 $8,400,000 $13,813,800 $22,716,794
Risk adjustment ↓5%
Btr Migration and modernization (risk-adjusted) $7,980,000 $13,123,110 $21,580,954
Three-year total: $42,684,064 Three-year present value: $34,314,181

Managed Services

  • Evidence and data.

    Bringing business-critical applications and workloads onto Azure does enable the many benefits of cloud computing (e.g., cost savings, scalability, agility, and enhanced security). However, organizations can easily experience skyrocketing costs and poor application performance without active management. This causes them to fail to meet the IT and business objectives set for their preceding transformation work. In such cases, customers often leverage managed services from a trusted partner to actively manage their Azure environment. Managed services are recurring income, and thus an attractive revenue opportunity for partners to pursue.

    Most interviewees say their partner organizations still segment their managed service offerings into separate tiers of services, each coming in at different price points. However, like with migration and modernization, many partners are taking a new approach of zeroing in on how to support their clients’ desired business outcomes. By providing more modular options (e.g., managing a security or a CRM stack, providing additional support layers) and focusing less on SKUs, partners are demystifying managed services for their clients and better addressing their needs. Ultimately, partners are making their managed services offerings more strategic and hands-off in nature, and this helps to increase their land-and-expand opportunities within existing clients.

    • Interviewees say partner organizations are decomplicating their managed services models so that customers are sure they are getting what they need, even with the cheapest option. One interviewee whose partner organization eliminated tiering altogether shared: “Basic managed services on all Azure is included. You’re going to get 24/7 support and our platform technology. ... And there’s different layers they can have in the technology set, but that’s what you can imagine they get as a standard offering when they’re buying Azure through us.”
    • Regarding additional layers for purchase, the interviewee added: “They could get additional support layers at the application level … And then we have, of course, the data protection layers, both on security backup and things like that as well as compliance, governance, GDPR [General Data Protection Regulation], and other related areas. There are [informal] levels that we think about with customers, but every customer gets 24/7 support and our platform no matter what.”
    • Because of the attractiveness of recurring revenue streams, partners are proposing managed services early on in talks with customers. Some are even bundling it in with professional services. An interviewee at one such partner said: “We usually bring up and quote the managed services before the migration. The reason for that is that’s usually one of their concerns in even making the move to cloud. They worry that they might not have enough in-house skills to run it once it’s there. So, to alleviate that challenge to migration, we always present what we would offer as managed services to either help them and/or run it for them once it’s migrated up into the cloud.”
  • Modeling and assumptions.

    For the composite partner organization, Forrester assumes that:

    • Managed services deals are sold as a direct result of migration and/or modernization work, with an attach rate of 30% in Year 1. This grows by 10% year-over-year as some customers renew their managed services contracts annually.
    • The average monthly fee for Azure managed services across all offerings is $30,000.
    • Average managed services gross margins are 55%.
  • Risks.

    Pricing and offerings unique to each practice organization may impact other partners’ realization of this benefit category.

  • Results.

    To account for these risks, Forrester adjusted this benefit downward by 5%, yielding a three-year, risk-adjusted total PV gross profit of $8.7 million.

Managed Services

Ref. Metric Source Year 1 Year 2 Year 3
C1 Number of migration and modernization projects completed B3 21 31 47
C2 Managed services attach rate Interviews 30% 33% 36%
C3 Number of managed services projects completed C1*C2 6 16 37
C4 Average managed services deal size (in monthly recurring revenue) Interviews $30,000 $30,000 $30,000
C5 Total managed services revenues C3*(C4*12) $2,160,000 $5,760,000 $13,320,000
C6 Average gross margin for managed services Interviews 55% 55% 55%
Ct Managed services C5*C6 $1,188,000 $3,168,000 $7,326,000
Risk adjustment ↓5%
Ctr Managed services (risk-adjusted) $1,128,600 $3,009,600 $6,959,700
Three-year total: $11,097,900 Three-year present value: $8,742,198

“Anything in and around the application usually contains a data component. Even if we start just by working on the application, typically that project then turns into analytics work or has a data element incorporated in it.”

Analytics Services

  • Evidence and data.

    The newest opportunity area for partners that was not explored in the previous 2020 study is Azure analytics services. Partners are investing in analytics practices to help customers get value out of their enormous amounts of data. While there has been less stringent sequencing for Azure journeys overall, analytics projects are most often the third phase of any cloud workload migration. After the data is lifted and shifted to the cloud and configured for optimization (e.g., cost control, correct governance and administration in place, compliance and successful integration ensured, etc.), customers are looking to extract actionable insights and thus business value.

    Analytics work is currently executed as a one-time professional service that could include modernization activities (e.g., setting up a data warehouse or a data lake) and building data integrations into other technology like a CRM, enterprise resource planning (ERP), or other customer or automation systems. Eventually, some partners believe that their customers will be comfortable enough to allow them to fully manage data as a service (i.e., with analytics-as-a-service offerings). Interviewees from partner organizations shared the following regarding the analytics services they are offering:

    • “Analytics is the largest growth area right now because more and more clients are wanting to realize additional business value out of cloud. We’re kind of through that first part of the journey with customers saying, ‘I see value in the cloud, and how it can save me money on running everything myself at my own data center.’ But now they’re starting to say, ‘What else can the business realize out of cloud?’ That’s where the analytics really come into play, because now they have a lot more insights than they had access to when everything was siloed.”
    • “For a lot of customers, analytics is tethered to modernization. Traditionally, we think of modernization as making an app less legacy and more modern, [using] cloud native services to make it run better, add new features, etc. But now, in many cases, the customer is thinking of their modernization like, ‘Can I bring my previous reporting and analytics into a more modern state where I have better insights or can allow my business users to self-query without additional support?’”
    • “Today, analytics is more project-based work. Typically, we’ve either done another project or are coming in fresh to help a client that has a need to create a data warehouse or a data lake and get more value out of their data. What we usually see is that, when we’re not there at the beginning, they’ve tried something else and they’re just not getting anything out of the data. So, we’ll come in and help them with that.”
    • “We’d love to get to where analytics is a managed service. I’ve heard of data as a service. I’m just not sure that a lot of people would be comfortable outsourcing who manages their data, at least not amongst our customers, not yet. I’m not saying it won’t get there; it’s tricky since data is the number one asset for so many people.”
  • Modeling and assumptions.

    For the composite partner organization, Forrester assumes that:

    • Forty percent of projects include an analytics component in Year 1. This grows by 35% year-over-year as the composite partner rapidly launches its new analytics offerings and customers buy into the hype, so 73% of projects include analytics in Year 3.
    • The average deal size of analytics work is $1 million.
    • Average analytics gross margins are 40%.
  • Risks.

    Pricing and offerings unique to each practice might impact other partners’ realization of this benefit.

  • Results.

    To account for these risks, Forrester adjusted this revenue stream downward by 5%, yielding a three-year, risk-adjusted total PV gross profit of $21.3 million.

Analytics Services

Ref. Metric Source Year 1 Year 2 Year 3
D1 Number of Azure projects completed Composite 30 39 51
D2 Percentage of projects with analytics components Interviews 40% 54% 73%
D3 Number of analytics projects completed D1*D2 12 21 37
D4 Average analytics deal size Interviews $1,000,000 $1,000,000 $1,000,000
D5 Total analytics revenues D3*D4 $12,000,000 $21,060,000 $36,960,300
D6 Average gross margin for analytics Interviews 40% 40% 40%
Dt Analytics services D5*D6 $4,800,000 $8,424,000 $14,784,120
Risk adjustment ↓5%
Dtr Analytics services (risk-adjusted) $4,560,000 $8,002,800 $14,044,914
Three-year total: $26,607,714 Three-year present value: $21,311,491
“The sweet spot really is seeing a path to get the customers to a reasonable amount of consumption that you can manage as well as create. That’s the most important thing.”

Azure Consumption Resell

  • Evidence and data.

    Partners continue to resell Azure consumption as an additional revenue stream, but this is primarily as a means of business development. Azure consumption reselling (ACR) means partners are in a better position to manage the end-to-end customer relationship, allowing them to further embed themselves into customers’ Azure journeys. Ultimately, they are better positioned to drive more potential professional or managed services engagements. By going beyond the basics of reactive business support around their customers’ Azure consumption, successful resellers gain insight into opportunity areas ripe for tailored solutioning (i.e., bundling their own or third-party services with traditional Azure services).

    Interviewees from partner organizations shared the following anecdotes concerning ACR within their practices:

    • “We do participate as CSP [cloud services providers] for those customers that fall into the low end of the Global 2000 segment. All of the customers that we would call enterprise customers Microsoft has in their strategic and major category, so they have enterprise agreements and CSP is usually not in play for those.”
    • “Azure consumption and resale would be single digit percentages as far as revenue goes. If you’re talking about the services that we drive by virtue of Azure, it’s 50% or more.”
    • “Out of $200 million in ACR, less than $200,000 is under CSP. The main reason we’re tied to so much ACR is because it helps us drive services. Strategically, we as an organization prioritize selling services. We love selling licenses, but in large enterprise accounts where you can sell large services deals there’s a little bit of a conflict in selling CSP versus EA [enterprise architecture]. Microsoft is going to sell the license; we’re going to do the services.”
    • “I would say maybe a third of customers are coming through as a CSP and the other two-thirds are coming direct from Microsoft.”
  • Modeling and assumptions.

    For the composite partner organization, Forrester assumes that:

    • Total annual Azure consumption is $15 million in Year 1 and grows by 2% year-over-year by virtue of the composite partner organization’s landing-and-expanding work with each customer, which leads to an increase in their Azure consumption.
    • Average Azure consumption resell margins were 5%. Given a CSP discount on Azure consumption, partners typically retained anywhere from 1% to 15% of the margin, passing on any remainder of the discounts to their customers.
  • Risks.

    The following factors may impact other partners’ realization of this benefit category:

    • The type of licensing they support (e.g., EA vs. CSP).
    • The percentage of any Microsoft discounts on consumption partners decided to pass on to their customers.
    • Customers’ overall monthly Azure consumption levels.
  • Results.

    To account for these risks, Forrester adjusted this revenue stream downward by 5%, yielding a three-year, risk-adjusted total PV gross profit of $1.7 million.

Azure Consumption Resell

Ref. Metric Source Year 1 Year 2 Year 3
E1 Total annual Azure consumption Composite $15,000,000 $15,300,000 $15,606,000
E2 Average gross margin on Azure consumption Interviews 5% 5% 5%
Et Azure consumption resell E1*E2 $690,000 $703,800 $717,876
Risk adjustment ↓5%
Etr Azure consumption resell (risk-adjusted) $655,500 $668,610 $681,982
Three-year total: $2,006,092 Three-year present value: $1,660,863

Flexibility

The value of flexibility is unique to each partner. There are multiple scenarios in which a partner might choose to invest in a Microsoft Azure services practice and later realize additional revenue and margin opportunities, including:

  • Deepening existing customer relationships.

    Cultivating ongoing customer relationships is a major driver of organic growth for partners. One interviewee from a partner organization said: “By the second and third years, we’re really thinking hard on how we’re going to scale this customer relationship up. How are we going to make sure they maintain as a $5-million-plus account, and can we get them into that $10 million territory? … It’s generally a minimum of 30% growth that we’re typically looking for in an account, usually higher.”

  • Building proficiencies across workloads.

    To maximize the total revenue opportunity for building an Azure services practice, partners are increasingly growing their competencies and hence their ability to sell Azure solutions. One interviewee’s partner organization, which is one of Microsoft’s largest commercial partners, commands over $1 billion in Azure services revenues annually and credits much of its success to being not just competent, but highly skilled in each workload space. It also makes sure it has plenty of resources devoted accordingly and pays special attention to its biggest opportunity areas. Its interviewee said: “When you think about some of those specific areas, we’ve got 500-600 people just dedicated to SAP on Azure. We’ve got another 2,000 people on app services and cloud services that are related to all those other workloads.”

  • Developing internal IP to streamline and optimize service delivery.

    Interviewees’ partner organizations are transferring energy from downturned custom app development for customers to internal partner-use IP development. This helps them increase their margins by driving efficiency in their service delivery processes. One partner organization’s interviewee shared: “It goes back to tooling. We’re more efficient so we can realize additional profitability. We do it faster than our competitors, but we still can charge a little bit more of a premium.”

Flexibility would also be quantified when evaluated as part of a specific project (described in more detail in Appendix A).

Total Investments

Ref. Investments Initial Year 1 Year 2 Year 3 Total Present Value
Ftr Azure practice investments $1,435,088 $5,863,358 $9,559,325 $15,783,789 $32,641,559 $26,524,276
Total investments (risk adjusted) $1,435,088 $5,863,358 $9,559,325 $15,783,789 $32,641,559 $26,524,276

Azure Practice Investments

  • Evidence and data.

    Beyond direct service delivery costs (including base compensation and corporate overhead expenses for delivery resources), partners made several strategic investments in growing their Azure services business lines. These include:

    • Talent acquisition and hiring expenses.

      People are the greatest asset for an Azure services partner organization. As such, partners make investments to support talent acquisition and hiring efforts. This is especially important now as it is hard to attract and retain talent, let alone obtain the skillsets required to remain competitive and deliver quality work for clients.

    • Research and development (R&D) expenses.

      Investments in R&D are necessary for partners to: 1) develop custom tooling, templates, and processes in advance of Year 1 operations and 2) continuously automate and effectively scale their practices over time. Continued investment in R&D enables partners to improve their margins and create opportunities for new revenue streams.

    • Training expenses.

      Training staff is critical to keeping up with the competencies needed to deliver evolving classic services (e.g., refactoring and rearchitecting applications) and new advanced ones (e.g., analytics). Training also serves to achieve differentiation from the competition and attract more business. Through both internal training programs and formal Microsoft training courses and certifications, practice professionals can gain and tout mastery of critical competencies.

    • Sales and marketing expenses.

      This covers commissions for the salesforce on Azure services sales and nominal spend on marketing. For the most part, partners continue to rely more heavily on no-cost avenues of lead generation like word-of-mouth recommendations from customers and qualified leads from Microsoft. The most successful partners will still maintain a core set of marketing assets to generate awareness and support lead generation activities.

    • General and administrative (G&A) expenses.

      These expenses cover the cost of office space and utilities as well as the wages of various back-office functions (e.g., billing and invoicing, finance and accounting, forecasting, and legal).

  • Modeling and assumptions.

    For the composite partner organization, Forrester assumes that:

    • All investments are expressed as a percentage of gross Azure project revenues, which totals $37.3 million in Year 1 and grows to $100.3 million in Year 3.
    • Talent acquisition and hiring expenses represent .8% of gross revenues.
    • Initially, R&D expenses represent 3% of gross revenues (inferred from Year 1) as the partner organization stands up its practice and needs a greater investment to develop its offerings. From Year 1 on, this expenditure drops to 1% of gross revenues as it still needs R&D to refine offerings and create internal IP to drive efficiency, but less so than at the onset.
    • Training expenses represent .5% of gross revenues.
    • Sales and marketing expenses represent 10% of gross revenues.
    • G&A expenses represent 2% of gross revenues.
  • Risks.

    Practice expenses that other partners incur can vary widely based on several factors including, but not limited to, the types of services delivered, the ability to cross-train existing resources, the existing IP in place, the sales incentives offered, and the types of marketing activities required.

  • Results.

    To account for these risks, Forrester adjusted this investment upward by 10%, yielding a three-year, risk-adjusted total PV investment (discounted at 10%) of $26.5 million.

Azure Practice Investments

Ref. Metric Source Initial Year 1 Year 2 Year 3
F1 Total Azure project revenues A5+B6+C5+D6+E3 $0 $37,275,000 $60,771,300 $100,341,951
F2 Talent acquisition and hiring expenses F1*.8% $0 $298,200 $486,170 $802,736
F3 Research and development expenses Initial = F1*3% Y1-Y3 = F1*1% $1,118,250 $372,750 $607,713 $1,003,420
F4 Training expenses F1*.5% $186,375 $186,375 $303,857 $501,710
F5 Sales and marketing expenses F1*10% $0 $3,727,500 $6,077,130 $10,034,195
F6 General and administrative expenses F1*2% $0 $745,500 $1,215,426 $2,006,839
Ft Azure practice investments F2+F3+F4+F5+F6 $1,304,625 $5,330,325 $8,690,296 $14,348,899
Risk adjustment ↑10%
Ftr Azure practice investments (risk-adjusted) $1,435,0880 $5,863,358 $9,559,325 $15,783,789
Three-year total: $32,641,559 Three-year present value: $26,524,276

  • icon

    These risk-adjusted ROI, NPV, and payback period values are determined by applying risk-adjustment factors to the unadjusted results in each Benefit and Cost section.

Cash Flow Chart (Risk-Adjusted)

Cash Flow Table (Risk-Adjusted Estimates)

Initial Year 1 Year 2 Year 3 Total Present Value
Total costs ($1,435,088) ($5,863,358) ($9,559,325) ($15,783,789) ($32,641,559) ($26,524,276)
Total benefits $0 $14,797,913 $25,420,076 $44,068,294 $84,286,282 $67,570,137
Net benefits ($1,435,088) $8,934,555 $15,860,751 $28,284,505 $51,644,723 $41,045,861
ROI 155%

The financial results calculated in the Revenue Streams and Investments sections can be used to determine the ROI and NPV for the composite organization’s investment. Forrester assumes a yearly discount rate of 10% for this analysis.

“We are truly transforming our business around Microsoft. We see the opportunity.”

Senior Manager, information technology services

Conclusion

This year's study, founded upon interviews with 14 Azure service partners, reveals that businesses benefit by investing in a partnership with Microsoft. Cloud adoption continues to progress and committed Azure service partners are well-positioned to help their clients meet goals and succeed.

Five takeaways about the Azure partner opportunity from this year's interviews and analysis include:

  • A three-year return on investment of 155%.

    Interviewees said their partners invested in sales and marketing, research and development, talent acquisition and hiring, training, and general and administrative roles. These investments allowed organizations to build and grow the following revenue streams: strategy and assessment work, migration and modernization, analytics, managed services, and Azure consumption resale.

  • An 8x opportunity in follow-on services.

    Strategy and assessment sessions offer opportunities for significant follow-on professional and managed services. Migration work and modernization drive most ensuing services revenue, while managed services have the highest margins.

  • A 2x year-over-year Azure Analytics growth vs. other services.

    As customers become increasingly mature on the cloud, demand for services moves from migration support to modernization and cloud analytics. Consequently, deal sizes for analytics projects are some of the highest among Azure services, with projects selling for upwards of $1 million.

  • A 60% sales cycle reduction.

    With many customers already consuming Azure infrastructure, partners selling Azure services enjoyed shorter sales cycles as sales conversations were refocused around gaining value out of Azure rather than migrating workloads to Azure.

  • A services revenue per dollar of $7.51 for ACR.

    Partners earn services revenue many times over their Azure consumed revenue. For each dollar of ACR in year three, a composite partner earns $3.72 in professional revenue, $1.00 in managed services, and $2.79 in analytics.

To capitalize upon the Azure service partner opportunity, the interviewees shared specific best practices from their organizations. First, successful partners are offering a range of modernization services across Azure workloads as transformation initiatives often involve multiple workloads. Second, partners are achieving quick wins through initial projects before launching land-and-expand initiatives to become more deeply embedded in their customers’ Azure journeys. Third, partners are investing in post-migration analytics capabilities to help their customers acquire, integrate, and fully leverage cloud data and applications.

NEXT SECTION: Appendixes

Appendix A: Total Economic Impact

Total Economic Impact is a methodology developed by Forrester Research that enhances a company’s technology decision-making processes and assists vendors in communicating the value proposition of their products and services to clients. The TEI methodology helps companies demonstrate, justify, and realize the tangible value of IT initiatives to both senior management and other key business stakeholders.

Total Economic Impact Approach

  • icon

    Benefits represent the value delivered to the business by the product. The TEI methodology places equal weight on the measure of benefits and the measure of costs, allowing for a full examination of the effect of the technology on the entire organization.

  • icon

    Costs consider all expenses necessary to deliver the proposed value, or benefits, of the product. The cost category within TEI captures incremental costs over the existing environment for ongoing costs associated with the solution.

  • icon

    Flexibility represents the strategic value that can be obtained for some future additional investment building on top of the initial investment already made. Having the ability to capture that benefit has a PV that can be estimated.

  • icon

    Risks measure the uncertainty of benefit and cost estimates given: 1) the likelihood that estimates will meet original projections and 2) the likelihood that estimates will be tracked over time. TEI risk factors are based on “triangular distribution.”

  • icon
    PRESENT VALUE (PV)

    The present or current value of (discounted) cost and benefit estimates given at an interest rate (the discount rate). The PV of costs and benefits feed into the total NPV of cash flows.

  • icon
    NET PRESENT VALUE (NPV)

    The present or current value of (discounted) future net cash flows given an interest rate (the discount rate). A positive project NPV normally indicates that the investment should be made unless other projects have higher NPVs.

  • icon
    RETURN ON INVESTMENT (ROI)

    A project’s expected return in percentage terms. ROI is calculated by dividing net benefits (benefits less costs) by costs.

  • icon
    DISCOUNT RATE

    The interest rate used in cash flow analysis to take into account the time value of money. Organizations typically use discount rates between 8% and 16%.

  • icon
    PAYBACK PERIOD

    The breakeven point for an investment. This is the point in time at which net benefits (benefits minus costs) equal initial investment or cost.

The initial investment column contains costs incurred at “time 0” or at the beginning of Year 1 th at are not discounted. All other cash flows are discounted using the discount rate at the end of the year. PV calculations are calculated for each total cost and benefit estimate. NPV calculations in the summary tables are the sum of the initial investment and the discounted cash flows in each year. Sums and present value calculations of the Total Benefits, Total Costs, and Cash Flow tables may not exactly add up, as some rounding may occur.


Appendix B: Endnotes

1 Source: “Now Tech: Azure Services Providers, Q4 2020,” Forrester Research, Inc., October 14, 2020.

2 Total Economic Impact is a methodology developed by Forrester Research that enhances a company’s technology decision-making processes and assists vendors in communicating the value proposition of their products and services to clients. The TEI methodology helps companies demonstrate, justify, and realize the tangible value of IT initiatives to both senior management and other key business stakeholders.