JULY 2020

New Technology: The Projected Total Economic Impact™ Of CampusNexus® Engage

A Student-Lifecycle CRM Solution Built On Top Of Microsoft Dynamics And Azure

Anthology (a merger of Campus Management, Campus Labs, and iModules) provides a CRM solution that helps its university customers manage student lifecycles from admissions through alumni relations. The solution, CampusNexus Engage (Engage), is built on top of Microsoft Dynamics and Azure capabilities.

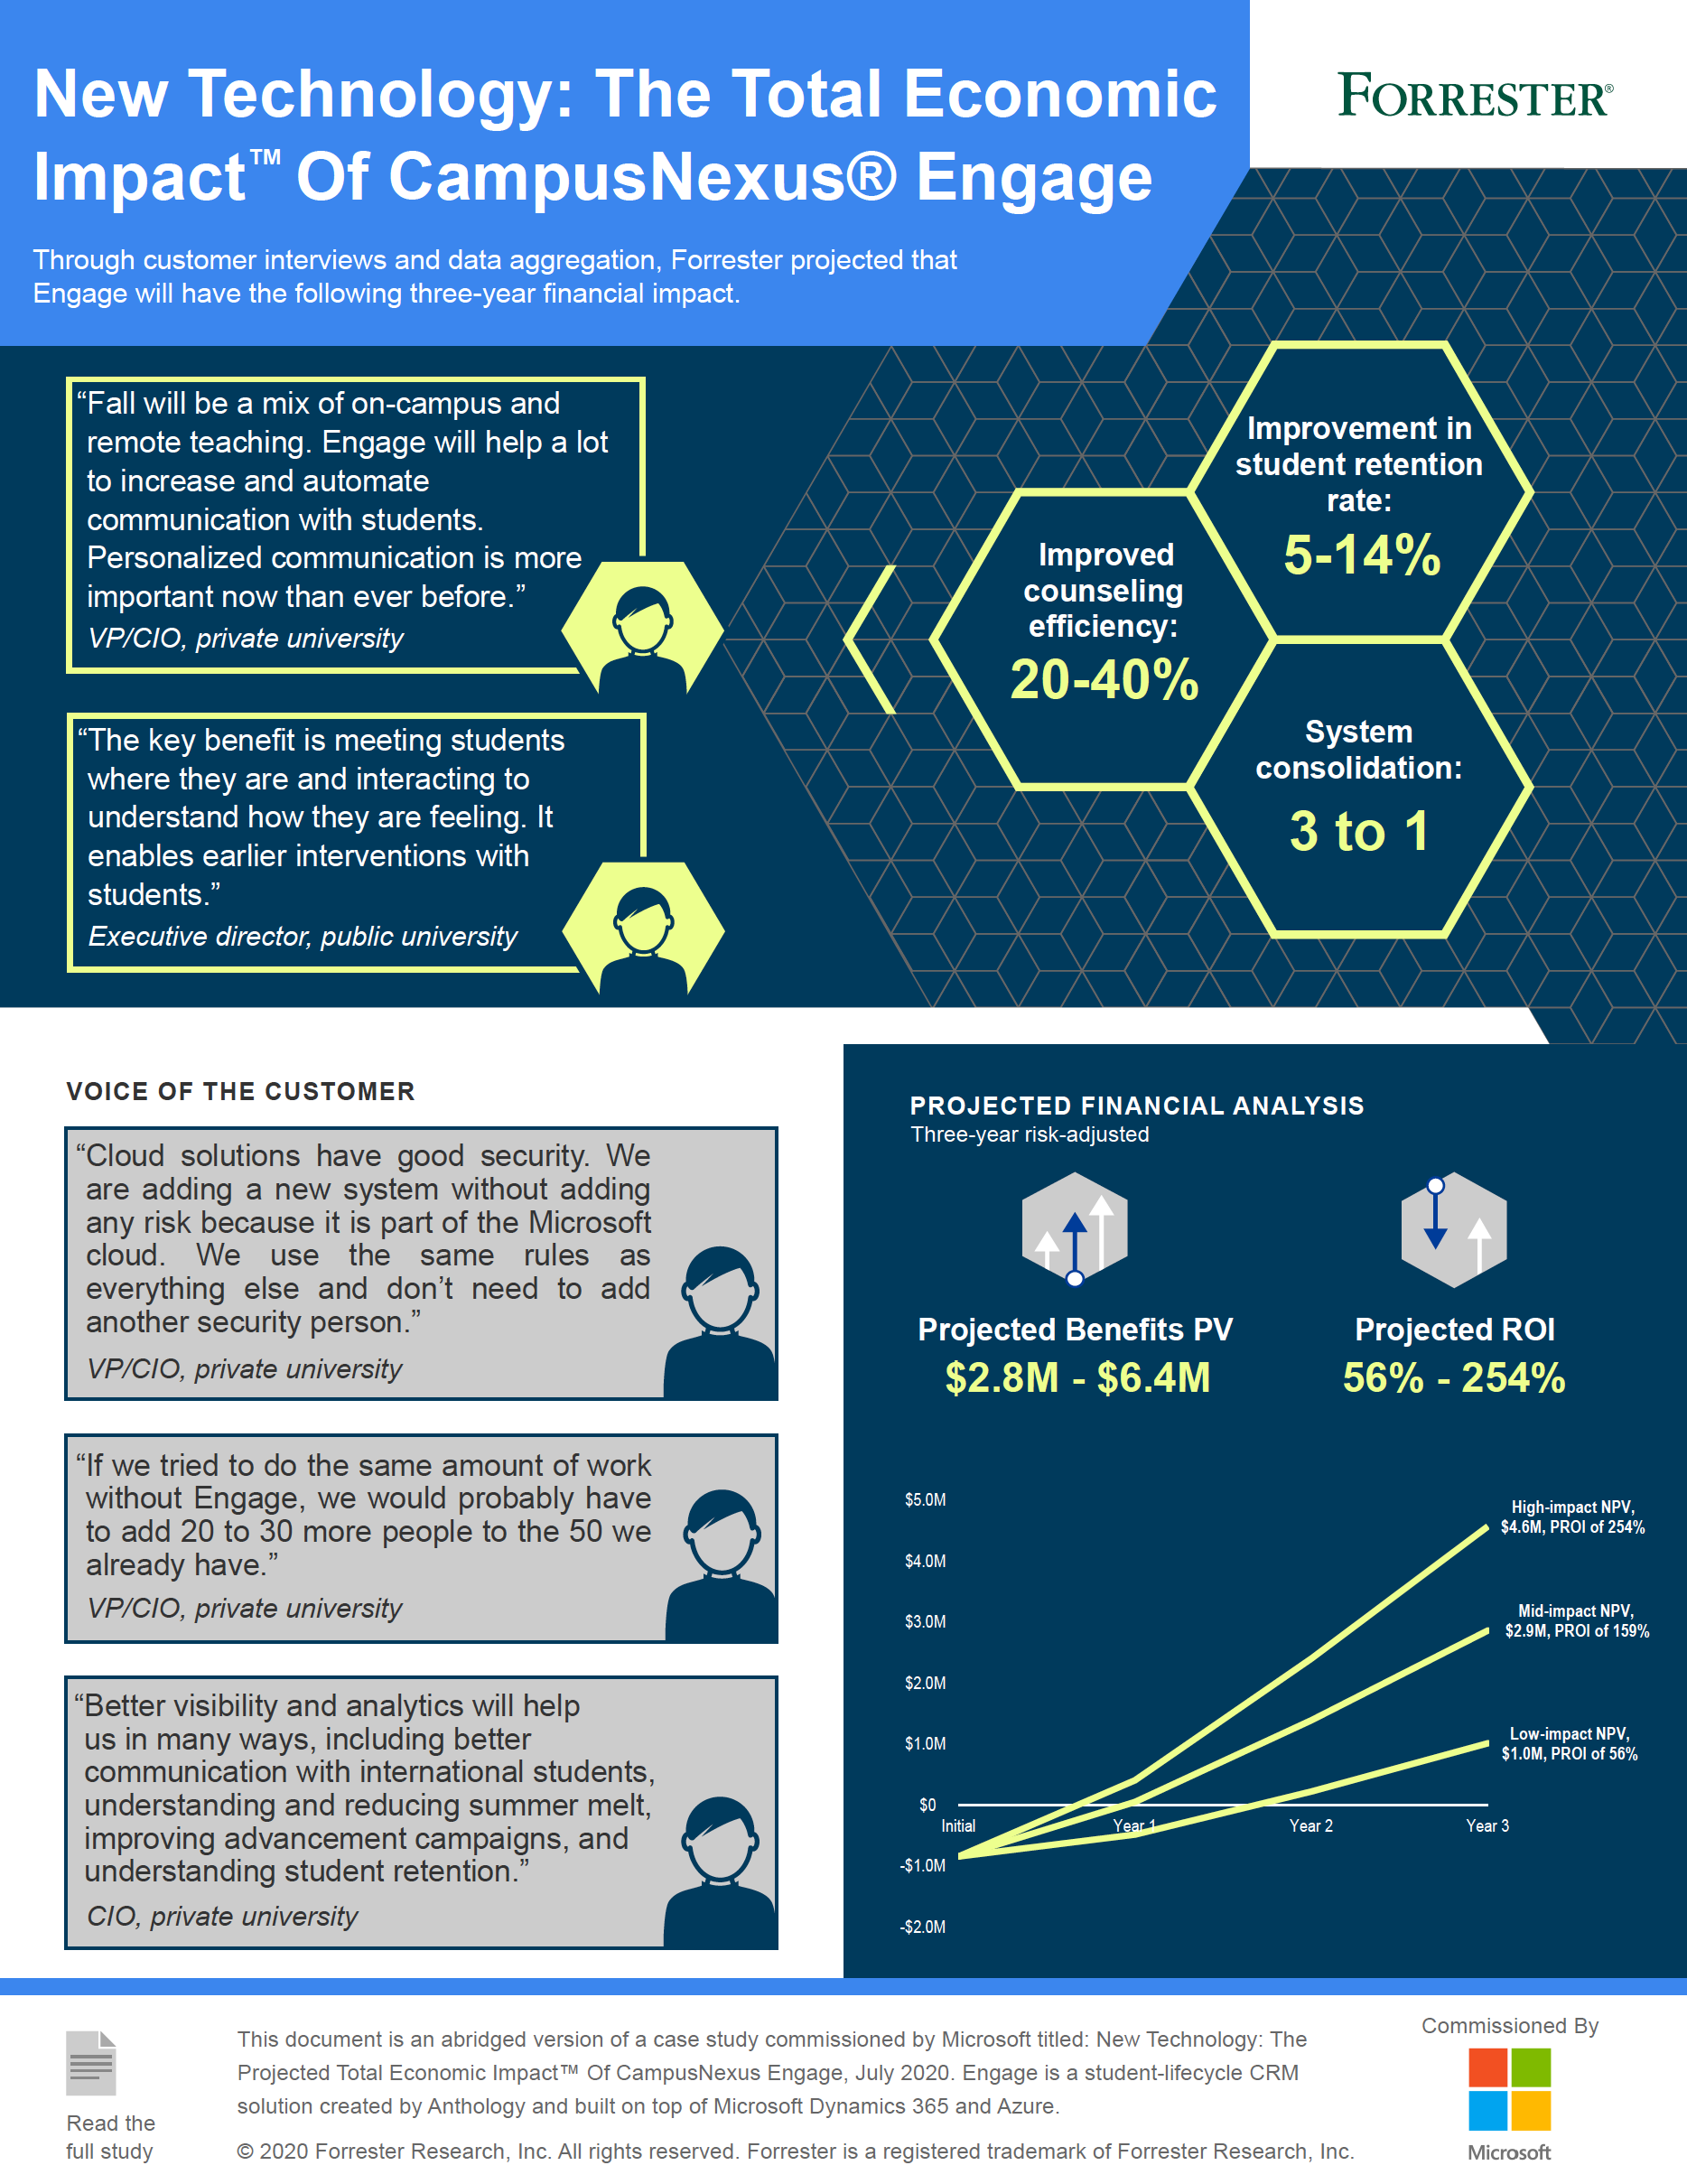
Microsoft commissioned Forrester Consulting to conduct a Total Economic Impact™ (TEI) study and examine the projected return on investment (PROI) universities may realize by deploying Engage. The purpose of this study is to provide readers with a framework to evaluate the potential financial impact of Engage on their organizations.

To better understand the benefits, costs, and risks associated with this investment, Forrester interviewed decision makers at four universities that have either recently gone live or are about to go live with one or more Engage modules. These interviewees said that they expect Engage to help them with overall student lifecycle engagement and that the initial focus areas include admissions and retention. They also expect Engage to make users more efficient and effective and to eliminate previous technology costs. Because Engage is built on top of Microsoft Dynamics and Azure, universities can benefit from previous investments and expertise in Microsoft technology.

Prior to using Engage, universities used a mix of other technology solutions and depended heavily on manual processes and spreadsheets. This made it difficult to understand students’ individual needs and effectively communicate with them during recruitment, admissions, and time as a student and as an alum. This resulted in poorer student experiences, increased costs and effort, and a general lack of visibility into student engagement activities.

Forrester developed a composite organization based on data gathered from the university interviews to reflect the Total Economic Impact that Engage could have on an organization. The composite organization is representative of the universities that Forrester interviewed and is used to present the aggregate financial analysis in this study. For this study, the composite organization is a 10,000-student university with 1,600 employees. Because the interviewed universities recently have or are in the final stages of rolling out Engage, Forrester has included a range of projected benefit scenarios in the financial analysis.

Project Director:
  • Jonathan Lipstiz

Project Contributors:
  • Benjamin Brown, Julia Fadzeyeva, and Steve Odell

Key Benefits

  • Improved student retention:

    70% increased to between 75% and 84%

  • Improved counseling efficiency:

    20% to 40%

  • System consolidation:

    Three down to one

Key Findings

  • Projected ROI
    56% to 254%
  • Benefits PV
    $2.8 million to $6.4 million
  • NPV
    $1.0 million to $4.6 million

Quantified projected benefits. The following present value (PV) quantified benefits are representative of those experienced by the universities interviewed:

  • Student graduation rates increase from 70% to between 75% and 84%.

    Engage improves communication between a wide range of university staff and faculty with students. Analytics helps identify students more likely to drop out. Taken all together, this enables a university to be more proactive in ensuring student satisfaction and retention. Improved graduation rates mean that more students continue to pay tuition. Applying an average operating margin of 8.9%, the improved graduation rate increases operating income by $361,000 to $1.2 million over three years.

  • University staff and faculty users are up to 40% more efficient and effective.

    Having a single, comprehensive CRM solution means employees working with students are more efficient and effective. This contributes to student benefits such as improved retention and satisfaction and also saves employees time. Without Engage, universities would have to add up to 40% more people to achieve the same level of service. Over three years, this equates to $2.5 million to $5.0 million in possible increased labor.

  • Engage can replace previous technology solutions.

    Universities are often replacing one or more systems with Engage. Reducing IT effort to support multiple systems is also possible. The financial analysis includes a range of eliminated solutions from no eliminated systems to $125,000 in savings per year.

Unquantified benefits. The interviewed organizations experienced the following benefits, which are not quantified for this study:

  • Better analytics.

    Universities achieve better, actionable analytics by capturing more information in one system. Because Engage is built on top of Dynamics and Azure, organizations can easily use the data in Power BI, Azure analytics tools and databases, and other solutions. Analytics can help improve student-related activities such as admissions, retention, and alumni engagement. It can also help with other activities such as accreditation.

  • Improved security and compliance.

    Engage includes all of the security components included in Microsoft Dynamics and the Azure platform. This makes securing data and users much easier and better and simplifies compliance with state and federal regulations.

Costs. The interviewed organizations experienced the following risk-adjusted PV costs, modeled by the composite organization:

  • Internal effort to deploy and manage Engage costs $1.1 million.

    The deployment lasts nine months and involves eight full-time equivalent (FTE) resources, a mix of IT and business. Ongoing effort to manage Engage and to provide training is two FTEs.

  • Professional services and licenses cost $700,000.

    The composite uses professional services for the initial deployment. After that, the IT department is self-sufficient on the modules deployed. Engage license costs are based on the number of users, students, and applicants. They include the necessary underlying Microsoft licenses and storage.

Forrester modeled a range of projected low-, medium-, and high-impact outcomes based on evaluated risk. This financial analysis projects that the composite organization accrues the following three-year net present value (NPV) projected ROI (PROI) for each scenario by enabling CampusNexus Engage:

  • Projected high impact of $4.6 million NPV and PROI of 254%.

  • Projected medium impact of $2.9 million NPV and PROI of 159%.

  • Projected low impact of $1.0 million NPV and PROI of 56%.

The three-year projected financial analysis for the composite organization results in $4.6 million PROI for High Impact NPV; $2.9 million PROI for Mid Impact NPV; and $1.0 million in PROI for Low Impact NPV.

New Tech TEI Framework And Methodology

The New Tech TEI methodology helps companies demonstrate and justify the projected tangible value of technology initiatives to both senior management and other key business stakeholders.

From the information provided in the interviews, Forrester has constructed a New Technology: Projected Total Economic Impact™ (New Tech TEI) framework for those organizations considering implementing Anthology CampusNexus Engage built on Microsoft Dynamics and Azure.

The objective of the framework is to identify the potential cost, benefit, flexibility, and risk factors that affect the investment decision. Forrester took a multistep approach to evaluate the projected impact that CampusNexus Engage may have on an organization:

  • DUE DILIGENCE

    Interviewed Microsoft and Anthology stakeholders and Forrester analysts to gather data relative to CampusNexus Engage, Microsoft Dynamics, and Microsoft Azure.

  • EARLY-IMPLEMENTATION CUSTOMER INTERVIEWS

    Interviewed four universities using CampusNexus Engage in a pilot or beta stage to obtain data with respect to projected costs, benefits, and risks.

  • COMPOSITE ORGANIZATION

    Designed a composite organization based on characteristics of the interviewed organizations.

  • PROJECTED FINANCIAL MODEL FRAMEWORK

    Constructed a financial model projection representative of the interviews using the New Tech TEI methodology and risk-adjusted the financial model based on issues and concerns of the interviewed organizations.

  • CASE STUDY

    Employed four fundamental elements of New Tech TEI in modeling CampusNexus Engage’s potential impact: benefits, costs, flexibility, and risks. Given the increasing sophistication that enterprises have regarding ROI analyses related to IT investments, Forrester’s TEI methodology serves to project a complete picture of the total economic impact of purchase decisions. Please see Appendix A for additional information on the New Tech TEI methodology.

DISCLOSURES

Readers should be aware of the following:

This study is commissioned by Microsoft and delivered by Forrester Consulting. It is not meant to be used as a competitive analysis.

Forrester makes no assumptions as to the potential ROI that other organizations will receive. Forrester strongly advises that readers use their own estimates within the framework provided in the report to determine the appropriateness of an investment in Anthology’s CampusNexus Engage, Microsoft Dynamics, or Microsoft Azure.

Microsoft and Anthology reviewed and provided feedback to Forrester, but Forrester maintains editorial control over the study and its findings and does not accept changes to the study that contradict Forrester’s findings or obscure the meaning of the study.

Anthology provided the customer names for the interviews but did not participate in the interviews.

BEFORE AND AFTER THE ENGAGE INVESTMENT

Interviewed Organizations

For this study, Forrester conducted four interviews with Anthology customers that recently went or are soon to go live with Engage. Interviewed customers include the following:

Type Interviewee Number of
Students
Number of
Employees
Number of
Users
Public university Executive director 21,000 3,500 50
Private university CIO 7,500 1,500 135
Public university VP/CIO 2,500 600 60
Public university VP marketing 10,000 1,000 35

Key Challenges

The interviewed universities experienced a range of challenges and saw many opportunities they could address by adopting a student CRM solution:

  • Universities struggled to engage with students on both a regular basis and at critical points in a lifecycle.

    Previous solutions and processes were disjointed or manual. This made it very difficult to foster two-way communication between students at all stages of their lifecycle, (from prospect to alum) and university staff and faculty. This led to process inefficiencies, lower student satisfaction, lower graduation rates, and lost tuition revenues.

  • Previous technologies did not provide robust enough analytics.

    Better analytics is central to providing better student experiences and to improve many functions such as recruitment and accreditation. Information was siloed and difficult to incorporate into analytics packages. This made it challenging to create actionable insights.

  • Security and compliance were difficult.

    Multiple solutions and manual processes, as well as housing technologies on-premises, made IT security more difficult. It was also a challenge for accreditation and to report on compliance with a wide range of state and federal regulations.

“As an inner-city school, our students need more guidance than a lot of other student groups. We needed a solution to create a high-touch, high-impact campus.”

VP/CIO, private university

“Anyone in enrollment management knows that if you are not smart about how you apply your resources, you are going to lose. You need real-time information about which prospects to pursue.”

VP marketing, public university


“The key benefit is meeting students where they are and interacting to understand how they are feeling. It enables earlier intervention with students.”

Executive director, public university

Key Projected Results

The interviews revealed that key results from the Engage investment include:

  • Digitizing and transforming processes.

    Universities can reimagine how they interact with students and how they deliver services. This makes them more efficient and, more importantly, effective. This delivers a wide range of benefits across the student lifecycle, including better-caliber admissions, higher graduation rates, and more involved alumni.

  • Leveraging prior Microsoft investments.

    Universities that are predominantly on Microsoft technologies can take advantage of investments in other solutions such as Azure, Dynamics, and Office 365 to achieve things such as better security and analytics. This can also reduce the incremental costs associated with Engage.

  • Consolidating solutions, making it easier for the IT organization

    Universities sometimes have multiple solutions for different schools or undergraduate versus graduate. Engage provides the flexibility to serve different audiences and needs in a single platform. This can eliminate other solution costs and free up IT department time to work on other projects.

  • Streamlining accreditation efforts.

    Interviewees see a longer-term potential for Engage to help with the accreditation process. One interviewee said: “Down the road, we see this helping with accreditation. We spoke with other schools that use Engage as part of a faculty portal showing their research and credentials. These are things accrediting bodies look at.” Another interviewee said: “Accreditation is more and more about outcomes and student experience. Engage helps with those.”

  • Providing additional assistance during the COVID-19 crisis.

    Universities must find new ways to interact with students during COVID-19. Interviewees all said that Engage will help them work with prospects and students. One interviewee said: “I had a number of people say they wish we had started implementing Engage six months earlier so it would be live during COVID. It will help a lot in communicating with many different constituents and make it possible for staff working from home to do their jobs better.”

“Engage is built on top of Dynamics, which makes it more future-proof. It also makes it easier to integrate into different systems. This is an area where Microsoft has excelled.”

VP/CIO, private university

“Fall will be a mix of on-campus and remote teaching. Engage will help a lot to increase and automate communication with students. Personalized communication is more important now than ever before.”

VP/CIO, private university


Composite Organization

Based on the interviews, Forrester constructed a TEI framework, a composite company, and an associated ROI analysis that illustrates the areas financially affected. The composite organization is representative of the four universities that Forrester interviewed and is used to present the aggregate financial analysis in the next section. The composite organization that Forrester synthesized from the customer interviews has the following characteristics:

The composite university is located in the US with one main campus. It has undergraduate and graduate programs as well as professional colleges. There are 10,000 students in total and 1,600 employees. The university deploys Engage for student recruitment and success, replacing separate systems for undergraduate, graduate, and professional schools. It is considering deploying additional modules such as alumni and grant management, but neither the benefits nor costs associated with these additional areas are included in the study.

Key assumptions:
  • 10,000 students
  • 1,600 employees
  • 85 users

Risk Treatment For Benefits And Costs Projections

Financial modeling based on projections inherently introduces more risk than analyzing actual, realized benefits and costs. Therefore, the New Technology TEI methodology includes an adjustment of projections by incorporating a risk factor.

For benefit calculations, Forrester incorporates risk by developing a range of projected outcomes, based on the data acquired during customer interviews. Forrester includes low, mid-range, and high estimates for each input variable in the benefit financial models. This creates a potential benefits range.

Costs are more easily estimated than benefits. For this reason, Forrester uses a simplified approach for risk treatment of cost categories by adjusting costs upward to develop a conservative financial analysis. This is described further in the Analysis Of Projected Costs section.

Impact risk is the risk that the business or technology needs of the organization may not be met by the investment, resulting in a range of overall total benefits. The greater the uncertainty, the wider the potential range of outcomes for benefit estimates

Implementation risk is the risk that a proposed investment may deviate from the original or expected requirements, resulting in higher costs than anticipated. The greater the uncertainty, the wider the potential range of outcomes for cost estimates.

NEXT SECTION: Analysis Of Projected Benefits

QUANTIFIED BENEFIT AND COST DATA AS APPLIED TO THE COMPOSITE

Total Projected Benefits

Benefit Year 1 Year 2 Year 3 Total Present Value
Total projected benefits (Low) $780,000 $1,238,500 $1,438,750 $3,457,250 $2,813,599
Total projected benefits (Mid) $1,368,500 $2,008,750 $2,342,500 $5,719,750 $4,664,170
Total projected benefits (High) $1,758,500 $2,802,250 $3,269,500 $7,830,250 $6,370,969

The table above shows the total of all benefits across the areas listed below, as well as present values (PVs) discounted at 10%. Over three years, the composite organization expects risk-adjusted total benefits to have a projected PV range of $2.8 to $6.4 million.


Improved Student Retention

More frequent and higher-quality communication and interaction between university faculty/staff and students improve student satisfaction and retention. This delivers a wide range of benefits, including higher retention/graduation rates. Interviewees described this as a primary goal and benefit. Forrester heard the following:

  • “We wanted to extend counseling capabilities to faculty to use because they interact with students more often. Faculty did not have access before. Now we have a true, 360-degree view of students.”

  • “The goal was to streamline the advisor processes. We redesigned the workflows and provided a better digital experience for everyone — faculty, staff, and students. Previously, students couldn’t schedule their own appointments to meet with advisors, and faculty did not have access to advisor notes and interactions.”

  • “Our target is to increase retention 15 to 20 percentage points. Our current graduation rate is 67%, and we want to increase it to 80+%.”

  • “We are digitizing how we engage with students — recruitment, enrollment, and retention. Engage is part of the suite of solutions to improve student experience.”

  • “Our four-year graduation rate is 74%. We looked at our peer institutions, and they are as high as 85%. That is where we want to get to.”

  • “Student satisfaction is low compared to regional peers. Our senior satisfaction rate is 70% versus 85% at our peers. Our goal is to get to at least 80%.”

  • “We have already improved graduation rates by six percentage points before the technology is even deployed because of the persona-based process changes we have put in place as part of the Engage project. This will increase once we go live.”

For the financial analysis, Forrester assumes:

  • Each year, 2,500 students are enrolled based on a 10,000-student total enrollment.

  • The baseline graduation rate is 70%, and this increases over the three years to 75% (low) to 84% (high).

  • On average, students leave after their second year, which means the organization loses two years of $15,000 tuition. Forrester assumes that transfer students do not replace any of these spaces.

  • The increased graduation rate tuition is recognized in the year that the student enrolls for model simplicity.

  • There is an 8.9% average operating margin. 1

This yields a three-year projected PV ranging from $361,000 to $1.2 million.

“We didn’t have the data on why students left or what we could have done differently to keep them. By the time advisors realized there was a problem, it was too late. Faculty could not alert advisors of a problem. We were reactive rather than proactive.”

Executive director, public university

Improved Student Retention

Ref. Metric Calculation Year 1 Year 2 Year 3 Total Present Value
A1 Incoming class size Based on four-year degree 2,500 2,500 2,500
A2 Baseline graduation rate 70% 70% 70%
A3LOW
A3MID
A3HIGH

Improved graduation rate

70%
72%
72%
72%
75%
77%
75%
80%
84%
A4LOW
A4MID
A4HIGH

Fewer students leaving

A1*(A3-A2)
0
50
50
50
125
175
125
250
350
A5 Lost tuition per leaver $15,000* 2 years $30,000 $30,000 $30,000
A6LOW
A6MID
A6HIGH

Tuition protection

A4*A5
$0
$1,500,000
$1,500,000
$1,500,000
$3,750,000
$5,250,000
$3,750,000
$7,500,000
$10,500,000
A7 Average operating margin 8.9% 8.9% 8.9%
AtLOW
AtMID
AtHIGH

Improved student retention

A6*A7
$0
$133,500
$133,500
$133,500
$333,750
$467,250
$333,750
$667,500
$934,500
$467,250
$1,134,750
$1,535,250
$361,082
$898,693
$1,209,624

“If we tried to do the same amount of work without Engage, we would probably have to add 20 to 30 more people to the 50 we already have.”

VP/CIO, private university

Increased User Efficiency

Engage users include faculty and staff who are interacting with students as part of recruiting, enrollment, and retention activities. Engage improves users’ effectiveness and efficiency. The previous retention benefit reflects effectiveness. Interviewees said that Engage streamlines and automates processes and that, without Engage, they would require new hires to achieve the same level of engagement with students. Interviewees shared the following examples:

  • “We have less than 50 advisors for a student population of 20,000. We needed to increase their ability to reach students with chatbots and self-service scheduling for students.”

  • “We are better able to interact with students remotely during COVID.”

  • “We couldn’t scale our organization without having Engage in place.”

  • “Having admission and retention in the same platform will reduce the number of people required from 10 to six.”

  • “We defined an admissions journey that has seven new communications. Without Engage, the staff wouldn’t be able to add that to what they currently do.”

  • “There will be 30 to 40 users between graduate, undergraduate, and pharmacy students. This includes admission counselors, recruiters, managers, and college deans. It will be a lot easier for us to engage the colleges in the recruiting process.”

For the composite organization, Forrester assumes:

  • There are 85 users, with 75% of them in place at the start of Year 1.

  • The efficiency gain ranges from 20% to 40%. This benefit is calculated as the additional number of people who would have to be added to accomplish the same amount of work.

  • The average fully burdened cost, including benefits and taxes, is $65,000.

This yields a three-year projected PV ranging from $2.5 million to $5.0 million.

Increased User Efficiency

Ref. Metric Calculation Year 1 Year 2 Year 3 Total Present Value
B1 Number of users 75% in Year 1 64 85 85
B2LOW

B2MID

B2HIGH


Added hires required for same service level
B1*20% [rounded down]
B1*30% [rounded down]
B1*40% [rounded down]
12

19

25
17

25

34
17

25

34
B3 Fully burdened cost Salary+30% $65,000 $65,000 $65,000
BtLOW
BtMID
BtHIGH

Increased user efficiency

B2*B3
$780,000
$1,235,000
$1,625,000
$1,105,000
$1,625,000
$2,210,000
$1,105,000
$1,625,000
$2,210,000
$2,990,000
$4,485,000
$6,045,000
$2,452,517
$3,686,589
$4,964,125

Technology Savings

Moving to Engage can lead to savings in three ways. First, Engage can replace a range of previous solutions, including CRM and analytics. Second, moving from an on-premises to a cloud-based solution can reduce infrastructure costs. Third, consolidating onto a single solution can reduce IT effort to manage the solutions. Interviewees shared the following:

  • “We are eliminating previous CRM solutions, which cost $40,000 per year. We are also eliminating a graduate enrollment management system that cost $50,000 per year.”

  • “We had contracts for other solutions, including CRM that cost up to $200,000 per year. All of that will be replaced by Engage.”

  • “We will be able to cut our spend on some other systems in half because those systems will still fulfill nonstudent purposes.”

  • “We can do things in Engage that required multiple systems to be integrated. Having everything in one place means it will work better together and cost less to maintain.”

For the financial analysis:

  • Forrester only includes the elimination of other system costs. A university may not be consolidating systems, which could reduce IT effort or moving from on-premises to the cloud.

  • Forrester uses the customer-provided examples as the range of possibilities and scaled to reflect the composite organization size.

  • Forrester assumes savings begin in Year 2 because previous contracts need to expire, and some systems are decommissioned after the Engage go-live.

  • The low case assumes that there are not previous systems being replaced.

This yields a three-year project PV ranging from $0 to $200,000.

“We will see IT savings from citizen development initiatives, integrating with Azure AD, and the integrations with Office 365 and Dynamics.”

CIO, private university

Technology Savings

Ref. Metric Calculation Year 1 Year 2 Year 3 Total Present Value
C1LOW
C1MID
C1HIGH

Technology savings
$0
$0
$0
$0
$50,000
$125,000
$0
$50,000
$125,000
CtLOW
CtMID
CtHIGH

Technology savings

=C1
$0
$0
$0
$0
$50,000
$125,000
$0
$50,000
$125,000
$0
$100,000
$250,000
$0
$78,888
$197,220

Unquantified Benefits

Two additional benefits are not included in the financial analysis because they underpin the previously discussed benefits.

    Better Analytics
  • The features built into Engage and the ability to easily integrate with other Microsoft solutions significantly improves analytics capabilities. Interviewees provided the following examples:

    • “We will be using data more proactively to improve student retention and success.”
    • “Because Engage is built on top of Dynamics, there is a robust data mining capability. We previously invested in Power BI and can now directly integrate the two rather than pull the data into another system. This ease of analytics was a big selling point.”
    • “Data democratization will give people better and faster access to the tools and information they need to do their jobs.”
    Improved Security And Compliance
  • Engage provides improved security and compliance because of built-in features and because it is built on top of Dynamics and Azure. Interviewees said:

    • “Separation of duties will be enhanced because of role-based access control and field-level data access. Everything being tied to the Microsoft back end is a big help.”
    • “Data is in the Microsoft cloud, which helps with compliance. We already use Microsoft ATP, DLP, and data encryption. These will all work well with Engage.”
    • “Anytime you move off of a decade-old solution, there will be new security best practices. We have a lot of confidence in Microsoft’s ability to secure transactions and confidential information protected by federal law. This includes HIPAA [Health Insurance Portability and Accountability Act] at our pharmacy school.”

“Better visibility and analytics will help us in many ways, including better communication with international students, understanding and reducing summer melt, improving advancement campaigns, and understanding student retention.”

CIO, private university

“Cloud solutions have good security. We are adding a new system without adding any risk because it is part of the Microsoft cloud. We use the same rules as everything else and don’t need to add another security person.”

VP/CIO, private university


Flexibility

The value of flexibility is clearly unique to each customer, and the measure of its value varies from organization to organization. There are multiple scenarios in which a customer might choose to implement Engage and later realize additional uses and business opportunities. These can include rolling out additional modules such as financial aid and advancement. A university can also role out Engage to other departments and schools. None of these future opportunities were included in the financial analysis.

Flexibility, as defined by TEI, represents an investment in additional capacity or capability that could be turned into business benefit for a future additional investment. This provides an organization with the "right" or the ability to engage in future initiatives but not the obligation to do so.

NEXT SECTION: Analysis Of Projected Costs

Total Projected Costs

Ref. Cost Initial Year 1 Year 2 Year 2 Total Present Value
Dtr Internal effort $600,600 $200,200 $200,200 $200,200 $1,201,200 $1,098,468
Etr External costs $242,813 $183,750 $183,750 $183,750 $794,063 $699,772
Total costs (risk-adjusted) $843,413 $383,950 $383,950 $383,950 $1,995,263 $1,798,240

The table above shows the total of all costs across the areas listed below, as well as present values (PVs) discounted at 10%. Over three years, the composite organization expects risk-adjusted total costs to have a PV of slightly less than $1.8 million.


Internal Effort

The internal effort includes that to deploy Engage and its ongoing management. Interviewees said that deployment was generally easy and accomplished on schedule. The number of internal resources required and the duration depended on the university’s size and the scope of the initial deployment. Internal resources came from the IT organizations and the various departments that would be using Engage. A best practice was to create personas for the various students and scenarios that would be addressed within Engage. It is important to include change management around culture and process changes. The ongoing internal effort includes managing the system and rolling out upgrades as well as providing super-user training to departments.

For the financial analysis, Forrester assumes:

  • It takes nine months to deploy Engage for student admissions and retention.

  • Eight FTEs from IT and various departments are involved in solution definition and rollout.

  • Two FTEs are involved in ongoing system management and super-user training.

  • The blended fully burdened cost across business and IT resources reflects a 50-50 split in team composition.

The duration and resources required will vary based on the scope of the deployment and internal skills available. To account for these risks, Forrester adjusted this cost upward by 10%, yielding a three-year risk-adjusted total PV of $1.1 million.

Implementation risk is the risk that a proposed investment may deviate from the original or expected requirements, resulting in higher costs than anticipated. The greater the uncertainty, the wider the potential costs

Internal Effort

Ref. Metric Calculation Initial Year 1 Year 2 Year 3
D1 Number of months 9 12 12 12
D2 Number of FTEs 8 2 2 2
D3 Blended monthly fully burdened cost (Salary+30%)/12 months $7,583 $7,583 $7,583 $7,583
Dt Internal effort D1*D2*D3 (rounded) $546,000 $182,000 $182,000 $182,000
Risk adjustment ↑10%
Dtr Internal effort (risk-adjusted) $600,600 $200,200 $200,200 $200,200

External Costs

External costs include professional services and Engage license costs. Interviewees used professional services as part of the deployment and said that they were self-sufficient afterward. If additional modules are rolled out, there may be additional professional services required, but Forrester included neither costs nor benefits associated with future projects in the analysis. License costs are based on the number of users, students, and applicants. The licenses include the required, underlying Microsoft licenses as well as necessary storage. Readers should work with an Anthology account representative to understand what their actual costs will be.

External costs will vary based on the organization’s size and in-house IT resources to work on the deployment. To account for these risks, Forrester adjusted this cost upward by 5%, yielding a three-year risk-adjusted total PV of $673,522.

External Costs

Ref. Metric Calculation Initial Year 1 Year 2 Year 3
E1 Professional services $100,000
E2 Licenses Prorated in initial period $131,250 $175,000 $175,000 $175,000
Et External costs E1+E2 $231,250 $175,000 $175,000 $175,000
Risk adjustment ↑5%
Etr External costs (risk-adjusted) $242,813 $183,750 $183,750 $183,750
NEXT SECTION: Financial Summary

CONSOLIDATED THREE-YEAR RISK-ADJUSTED METRICS
  • These risk-adjusted PROI, NPV, and payback period values are determined by applying risk-adjustment factors to the unadjusted results in each Benefit and Cost section.

The three-year projected financial analysis for the composite organization results in $4.6 million PROI for High Impact NPV; $2.9 million PROI for Mid Impact NPV; and $1.0 million in PROI for Low Impact NPV.

Cash Flow Table (Risk-Adjusted)

Initial Year 1 Year 2 Year 3 Total Present Value
Total costs ($843,413) ($383,950) ($383,950) ($383,950) ($1,995,263) ($1,798,240)
Total benefits (low) $0 $780,000 $1,238,500 $1,438,750 $3,457,250 $2,813,599
Total benefits (mid) $0 $1,368,500 $2,008,750 $2,342,500 $5,719,750 $4,664,170
Total benefits (high) $0 $1,758,500 $2,802,250 $3,269,500 $7,830,250 $6,370,969
Net benefits (low) ($843,413) $396,050 $854,550 $1,054,800 $1,461,988 $1,015,359
Net benefits (mid) ($843,413) $984,550 $1,624,800 $1,958,550 $3,724,488 $2,865,930
Net benefits (high) ($843,413) $1,374,550 $2,418,300 $2,885,550 $5,834,988 $4,572,729
PROI (low) 56%
PROI (mid) 159%
PROI (high) 254%
NEXT SECTION: Anthology CampusNexus Engage And Microsoft Dynamics: Overviews

The following information is provided by Anthology and Microsoft. Forrester has not validated any claims and does not endorse Anthology or Microsoft or their offerings.

CampusNexus® Engage

Campus Labs, Campus Management, and iModules have joined together to form Anthology. Anthology exists to help higher education advance and thrive. Through a connected data experience that offers a holistic view, creates efficiencies, and provides intelligence, Anthology inspires constituents to reach their full potential using technology insights in admission and enrollment management; student success and retention; institutional and learning effectiveness; alumni and advancement; and enterprise applications and infrastructure.

CampusNexus® Engage combines Anthology’s deep CRM solutions expertise with Microsoft’s application and cloud infrastructure to deliver a system of intelligence and engagement for higher education. Built using Microsoft Dynamics, Azure, and Power BI, the solution integrates higher education workflow processes and best practices with the latest innovations in artificial intelligence, machine learning, and business analytics to improve engagement and drive student and institutional success.

CampusNexus Engage works alongside your existing systems to help your institution gain insight across the student lifecycle and respond dynamically to each student’s unique experience and needs

  • Drive actions.

    Cultivate relationships through activities and action items based on a holistic view of each student.

  • Predict outcomes.

    Focus on leading indicators and predictive workflows from recruiting through career services.

  • Respond proactively.

    Automatically identify patterns of student behavior and respond earlier to potential issues.

  • Streamline enrollment.

    Leverage integrated forms, application review, and portal experiences to modernize your admissions process.

  • Empower students.

    Empower students with a personalized support team of staff and faculty and self-service portal.

  • Improve case management.

    Automate case management creation and workflows and track student issues through resolution.

  • Optimize marketing and events.

    Create and automate marketing and event campaigns and workflows to achieve strategic goals.

  • Engage alumni and friends.

    Manage outreach and fundraising campaigns.

  • Go mobile.

    Engage with students through their preferred communication channels and devices.

  • Extend across enterprise.

    Deploy once and implement across departments and campuses.

  • Leverage Microsoft products.

    Integrate other products into your student-focused initiatives and workflows, including Office 365, Teams, LinkedIn, and more.

Microsoft Dynamics 365

Dynamics 365 is a set of intelligent business applications that helps you run your entire institution and deliver greater results through predictive, AI-driven insights. Dynamics 365 can help customers accelerate digital transformation across Sales, Marketing, Service, Finance and Operations, Retail, and Human Resources. With Dynamics 365, you can see your data in one place—across hundreds of sources—for a single, 360-degree view of your student or organization, share data across business lines, and shift from being reactive to proactive with continuous insights that guide you to faster results. For Higher Education, integrated solutions built on Microsoft Dynamics, like CampusNexus® Engage from Anthology, can help schools gain insights into student data and analytics so educators can help students improve learning, optimize student and faculty engagement, predict outcomes, and improve institutional effectiveness.

NEXT SECTION: Appendix

Appendix A: New Technology: Projected Total Economic Impact

New Technology: Projected Total Economic Impact (New Tech TEI) is a methodology developed by Forrester Research that enhances a company’s technology decision-making processes and assists vendors in communicating the value proposition of their products and services to clients. The New Tech TEI methodology helps companies demonstrate and justify the projected tangible value of IT initiatives to both senior management and other key business stakeholders.

Total Economic Impact Approach

  • Projected Benefits represent the projected value to be delivered to the business by the product. The New Tech TEI methodology places equal weight on the measure of projected benefits and the measure of projected costs, allowing for a full examination of the effect of the technology on the entire organization.

  • Projected Costs consider all expenses necessary to deliver the proposed value, or benefits, of the product. The projected cost category within New Tech TEI captures incremental costs over the existing environment for ongoing costs associated with the solution.

  • Flexibility represents the strategic value that can be obtained for some future additional investment building on top of the initial investment already made. Having the ability to capture that benefit has a PV that can be estimated.

  • Risks measure the uncertainty of benefit and cost estimates given: 1) the likelihood that estimates will meet original projections and 2) the likelihood that estimates will be tracked over time.

  • PRESENT VALUE (PV)

    The present or current value of (discounted) cost and benefit estimates given at an interest rate (the discount rate). The PV of costs and benefits feed into the total NPV of cash flows.

  • NET PRESENT VALUE (NPV)

    The present or current value of (discounted ) future net cash flows given an interest rate (the discount rate). A positive project NPV normally indicates that the investment should be made, unless other projects have higher NPVs .

  • PROJECTED RETURN ON INVESTMENT (PROI)

    A project’s expected return in percentage terms. PROI is calculated by dividing net projected benefits (projected benefits less costs) by projected costs.

  • DISCOUNT RATE

    The interest rate used in cash flow analysis to take into account the time value of money. Organizations typically use discount rates between 8% and 16%.

  • PAYBACK PERIOD

    The breakeven point for an investment. This is the point in time at which net benefits (benefits minus costs) equal initial investment or cost.

The initial investment column contains costs incurred at “time 0” or at the beginning of Year 1 that are not discounted. All other cash flows are discounted using the discount rate at the end of the year. PV calculations are calculated for each total cost and benefit estimate. NPV calculations in the summary tables are the sum of the initial investment and the discounted cash flows in each year. Sums and present value calculations of the Total Benefits, Total Costs, and Cash Flow tables may not exactly add up, as some rounding may occur.