SEPTEMBER 2018

A Forrester Total Economic Impact™ Study Commissioned by New Relic

The Total Economic Impact™ Of The New Relic Platform

Cost Savings And Business Benefits Enabled By Digital Performance Measurement

Executive Summary

New Relic provides a suite of measurement instruments that helps organizations measure their Agile plus DevOps performance, adopt the cloud faster, and gather insight into their digital performance related to customer experience. New Relic commissioned Forrester Consulting to conduct a Total Economic ImpactTM (TEI) study and examine the potential return on investment (ROI) enterprises may realize by deploying the New Relic Platform. The purpose of this study is to provide readers with a framework to evaluate the potential financial impact of New Relic on their organizations’ Agile, DevOps, cloud adoption, and customer experience initiatives.

To better understand the benefits, costs, and risks associated with this investment, Forrester interviewed one large enterprise customer organization with several years of experience using New Relic tools.

Prior to using the New Relic Platform, the profiled enterprise had limited DevOps performance monitoring capability due to the cost and complexity of its small set of DevOps tools. These limitations led to a search for a modern suite of performance monitoring tools, resulting in the deployment of New Relic after extensive search, evaluation, and proof of concept. With New Relic, the organization gained an end-to-end view of its DevOps portfolio, shifting application performance monitoring (APM) further left to application developers, with a complete view from the browser through the application as well as its infrastructure.

“We’re pushing it so far left now we’re catching these issues in the development environment. It’s helping us to solve issues before they impact automated testing or things down the line that may cause more rework and slow down deployments or increase the lead time to get a deployment out the door. We’re shifting as much left as possible where it’s cheaper to fix a problem. And we’re trying to do it with everything, even automated tests. Anything we can push further left makes us faster.”
– Software development tech consultant, financial services firm

Key Findings

Quantified benefits. The interviewed organization experienced the following risk-adjusted present value (PV) quantified benefits:

  • Fewer incidents, faster resolution: $6,515,432

  • Decommissioned obsolete tools: $4,706,236

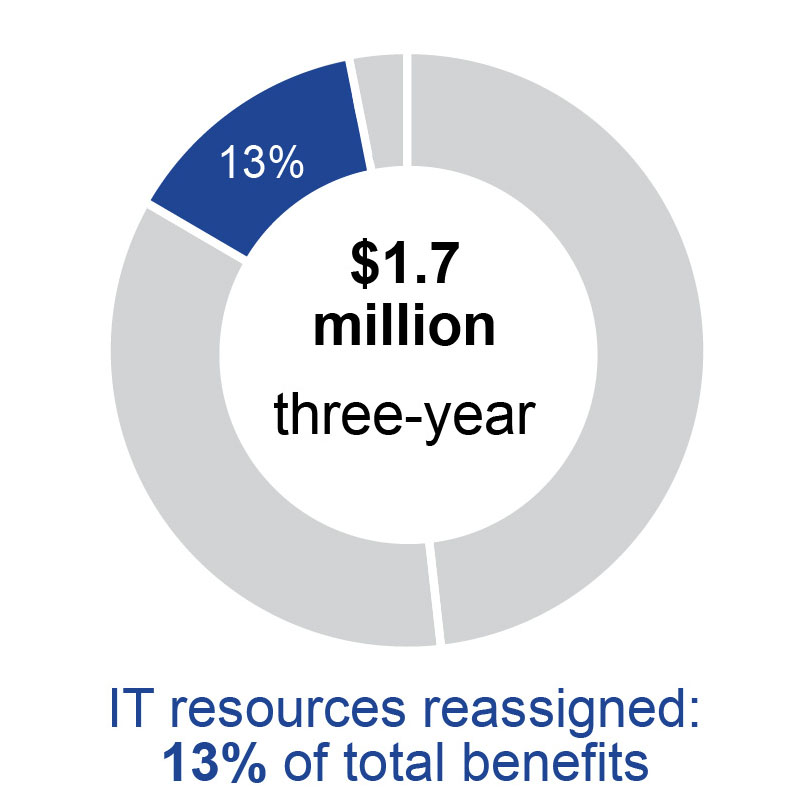
  • Labor and infrastructure costs avoided: $1,727,461

  • New Relic usage, setup, services costs: $6,047,192
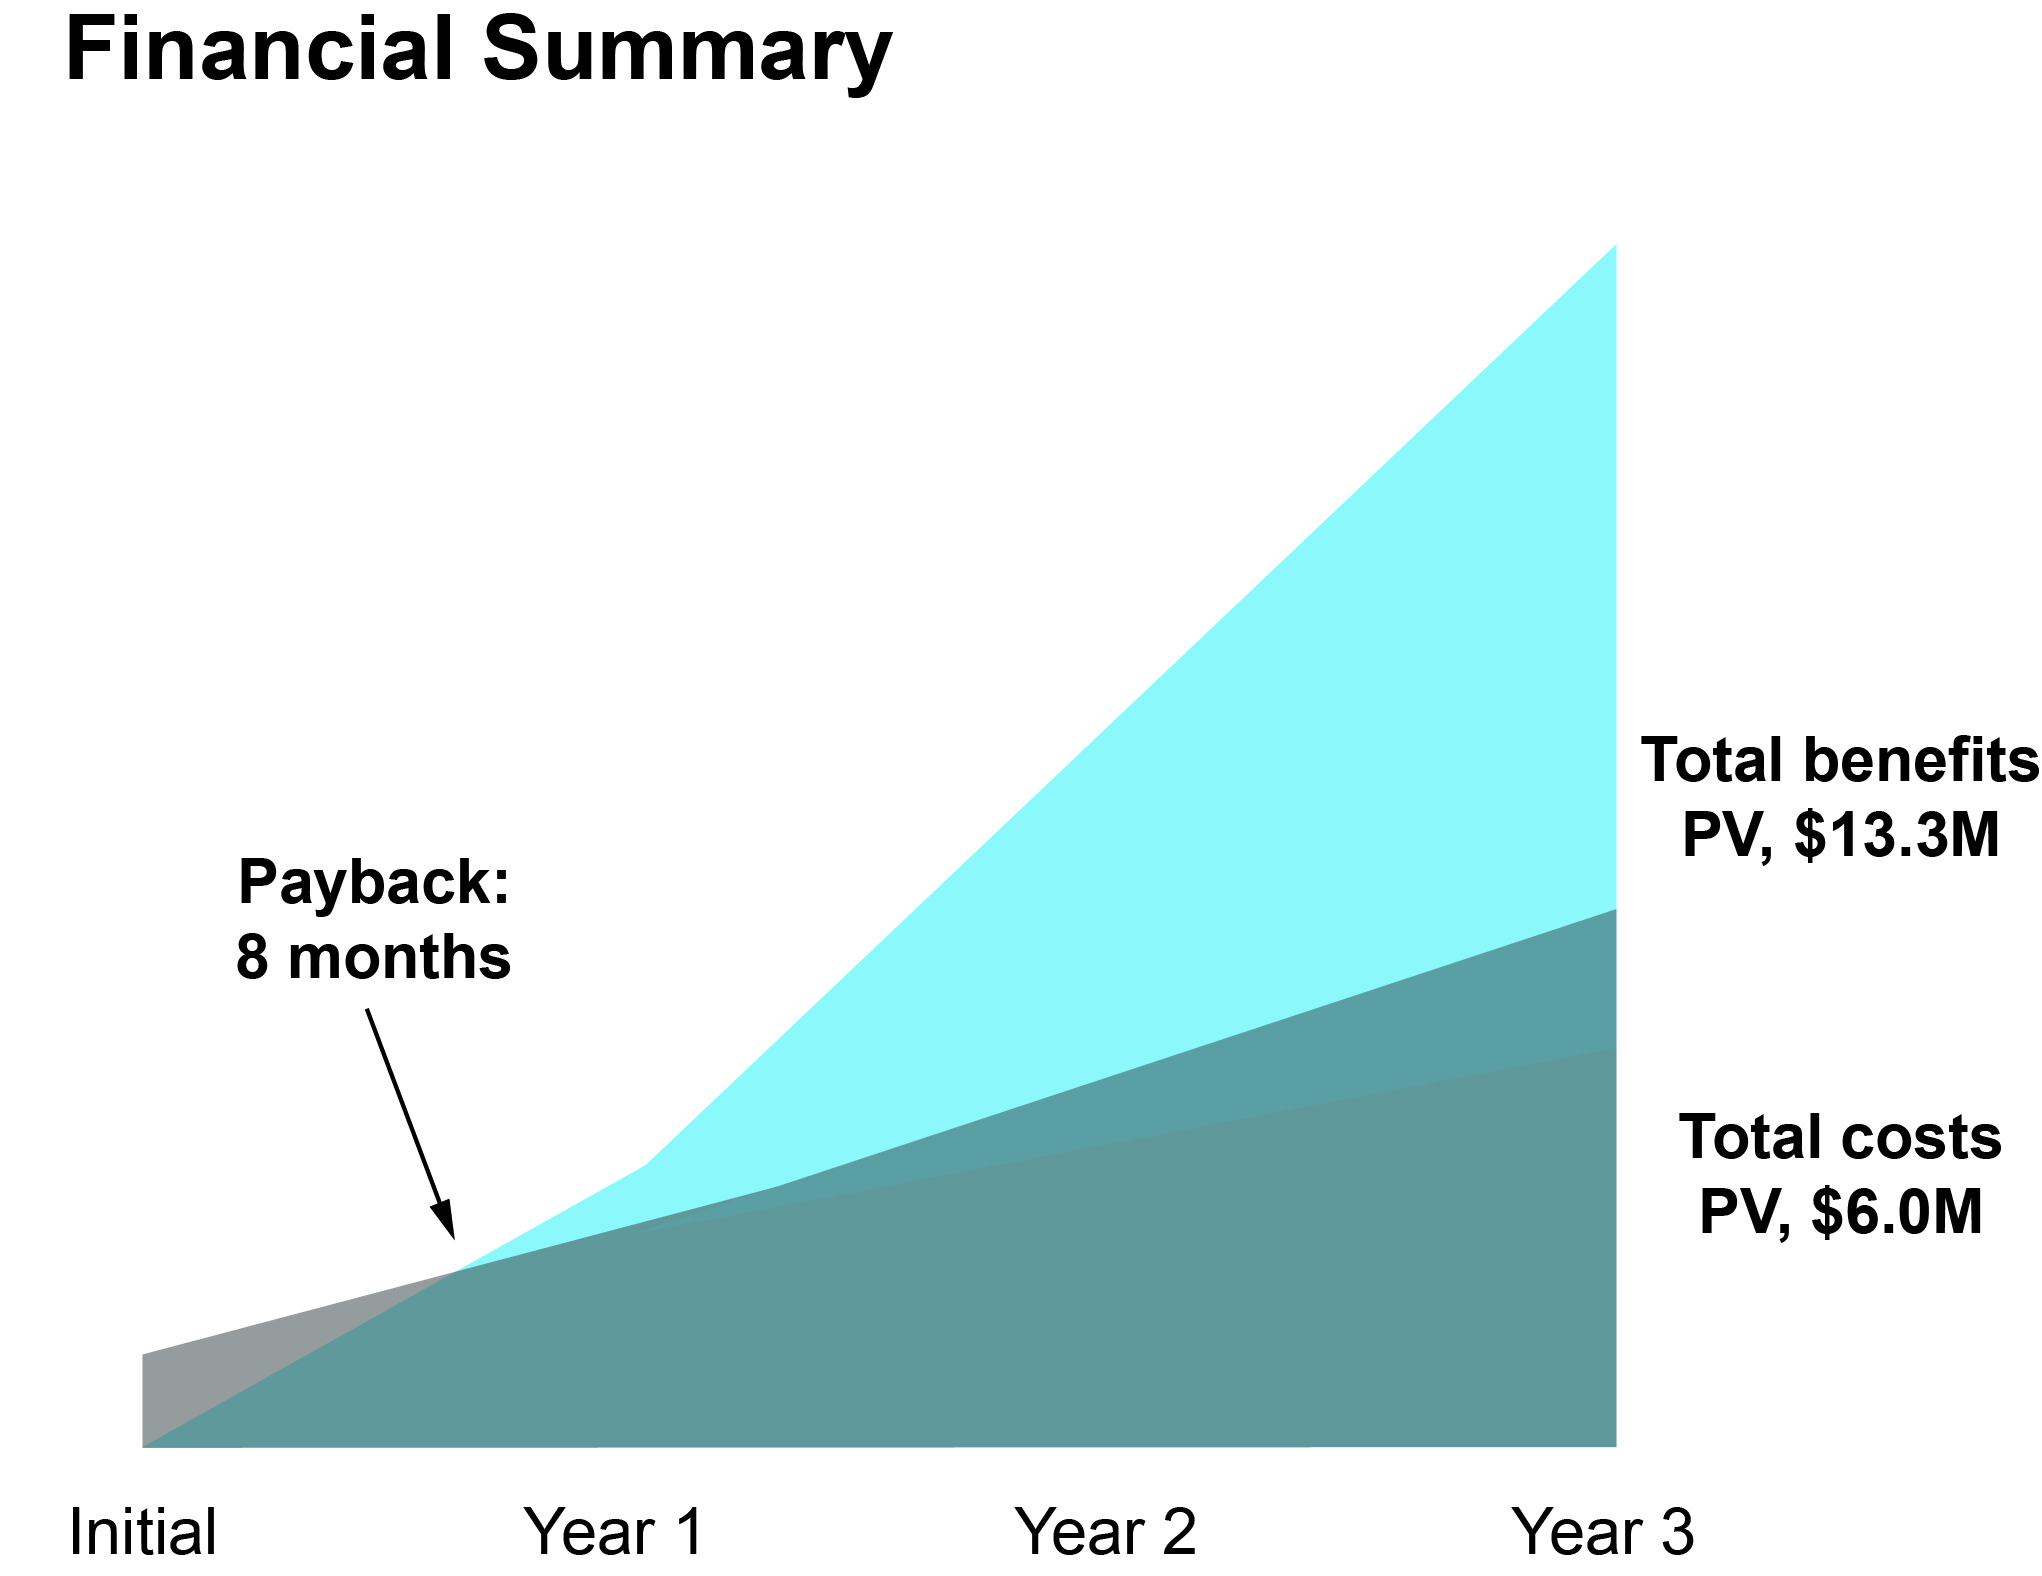
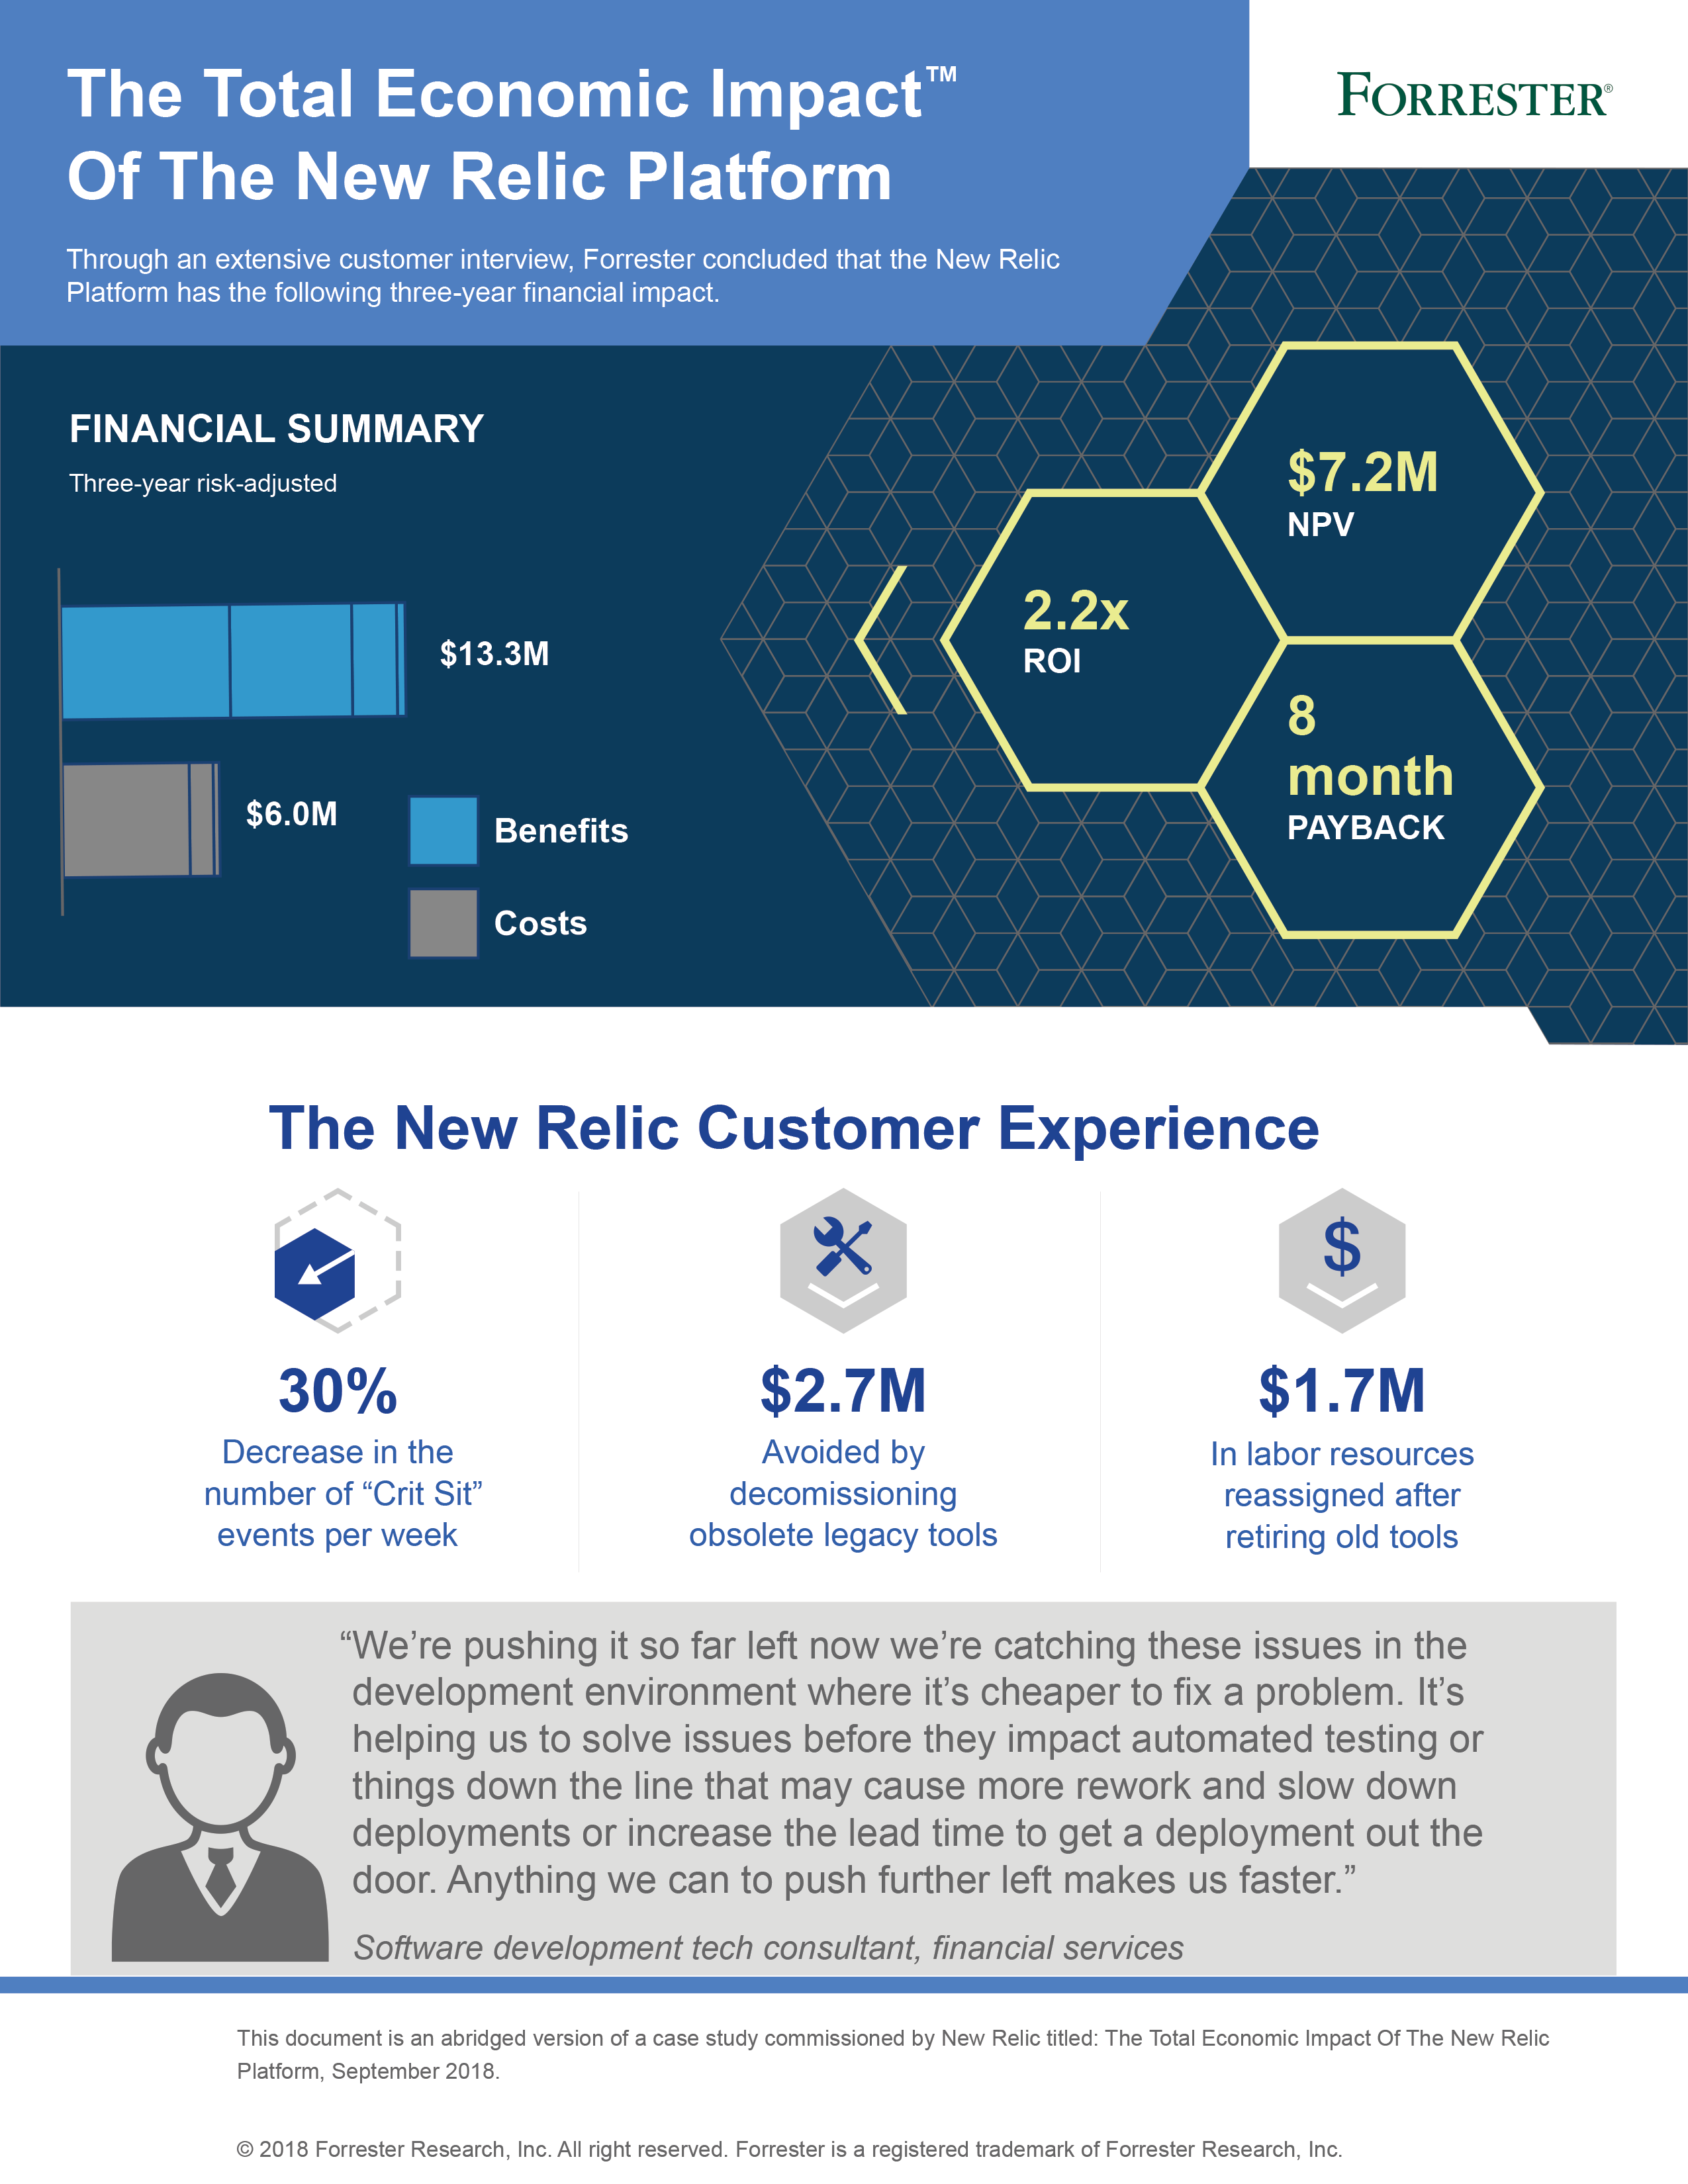
  • ROI
    120%

  • Benefits PV
    $13.3 million

  • NPV
    $7.2 million

  • Payback
    8 months

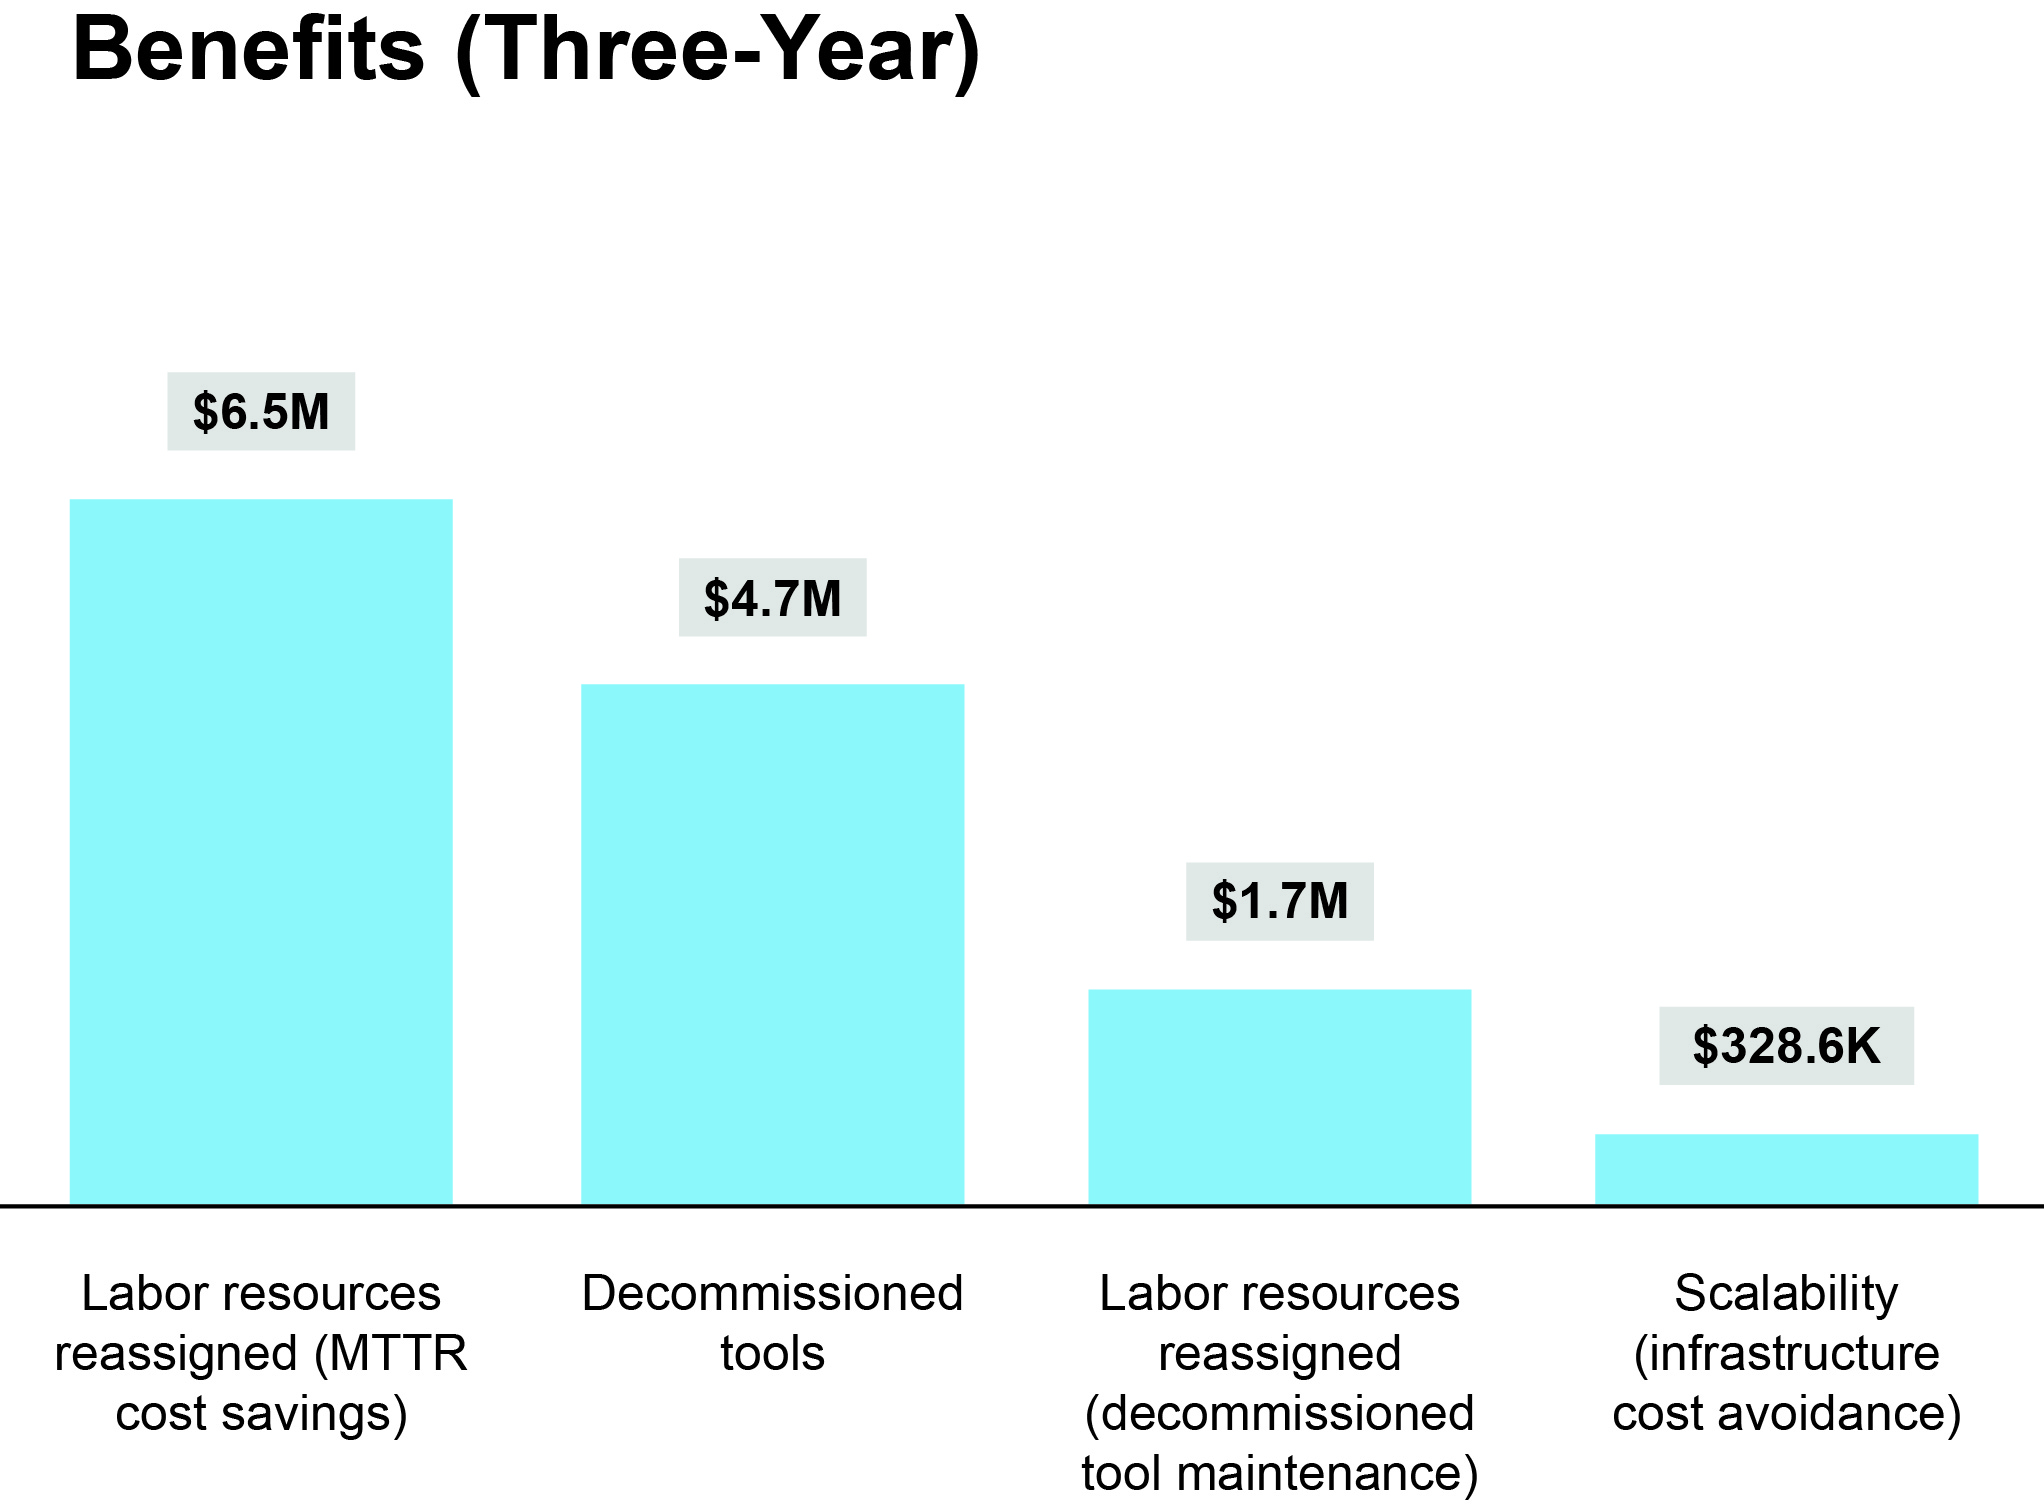
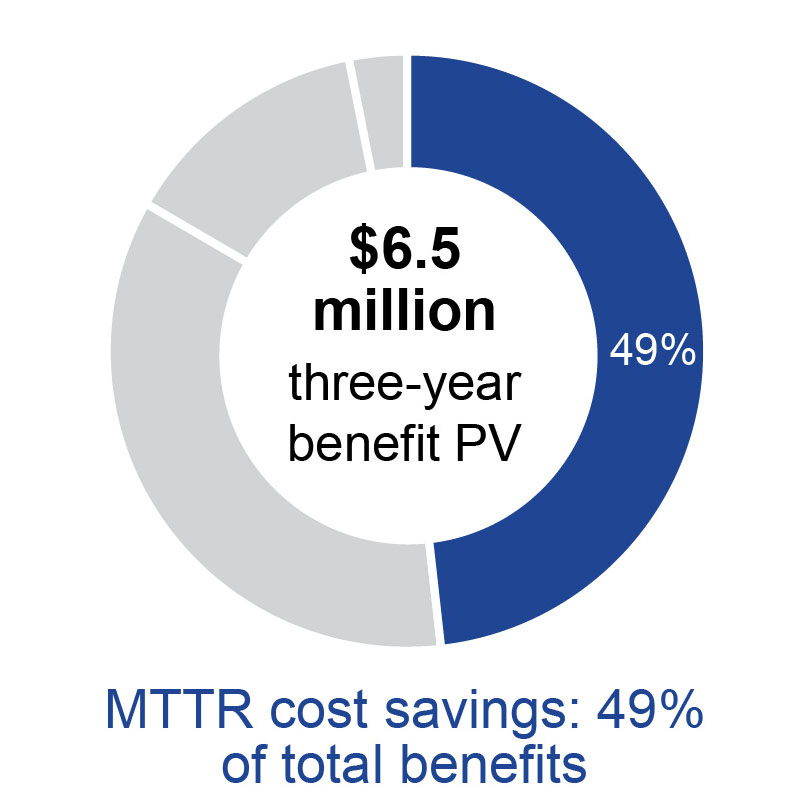
  • Labor cost savings from fewer incidents and reduced MTTR (mean- time-to-resolution).

    Cost savings resulting from fewer IT resources fixing problems faster (and earlier in the development/operations life cycle) produced $6.5 million in present value over three years.

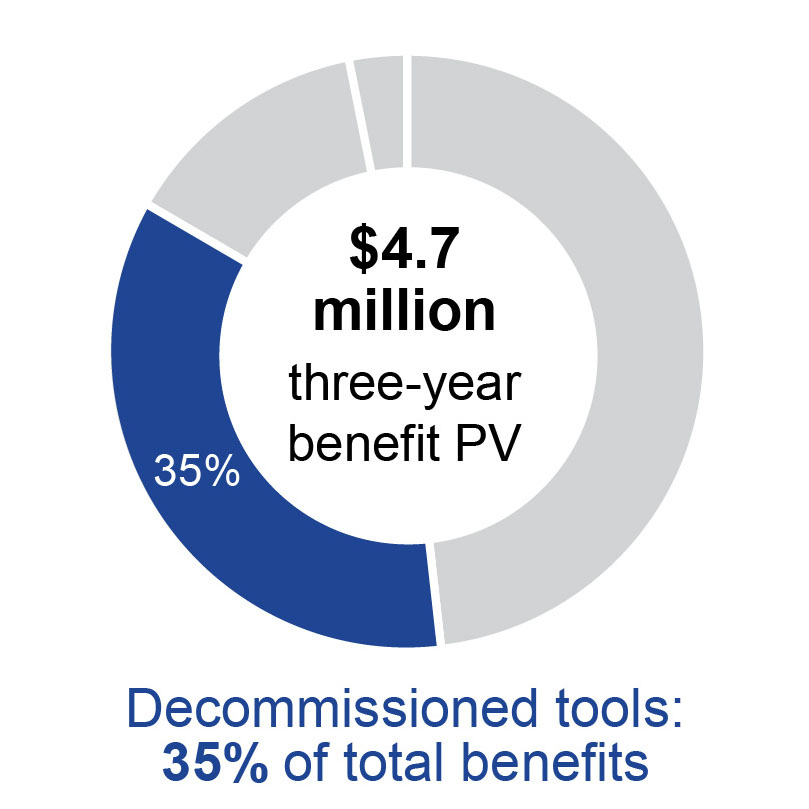
  • Decommissioning obsolete monitoring tools.

    Simply by replacing older, expensive, complicated monitoring tools, the company saved an estimated $4.7 million in license and maintenance costs.

  • IT resources reassigned from decommissioned tool maintenance.

    The company also saved $1.7 in IT labor cost savings for the care of old tools.

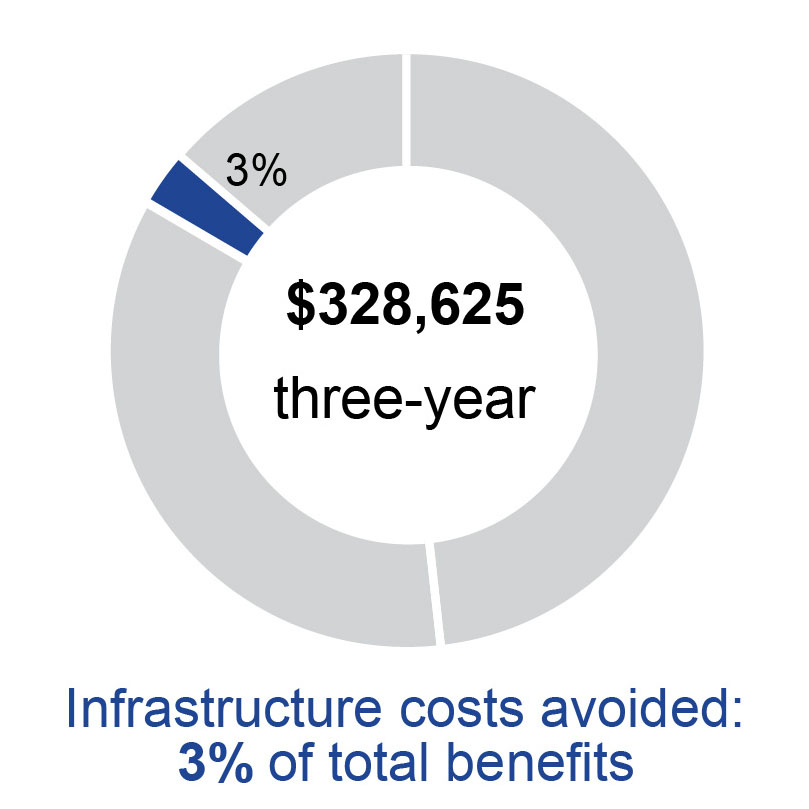
  • Infrastructure costs avoided.

    Moving to New Relic’s cloud-based APM-as-a-service allowed the company to avoid a new investment in on-premises storage/compute devices.

Unquantified benefits. The interviewed organization experienced the following benefits, which are not quantified for this study:

  • Better business decisions.

    Dashboards and insight enable the company to focus on actual customer behavior and more intelligently prioritize work. By using the metrics and visibility that New Relic provides, the company can drive good business decisions

  • Lower frustration, greater DevOps job satisfaction.

    Due to a simplified, more intelligent, more satisfying, and less frustrating DevOps work environment, IT staff are more efficient and effective, and thus gain greater job satisfaction.

  • Eliminating Business Disruption.

    Reducing the number of interruptions to normal business practices can prove to be an invaluable asset. Lost productivity due to business interruptions can pose significant cost to companies. Additionally, these business interruptions can cause friction in the customer experience which could negatively affect a company’s public image.

Costs. The interviewed organization experienced the following risk- adjusted PV costs:

  • New Relic usage fees.

    The company spent $4.9 million in present value terms over three years on usage fees.

  • Setup and deployment.

    The company spent $922,000 for the initial setup and subsequent rollout of New Relic.

  • Professional services.

    The company spent $230,000 in the first six months on professional services to accelerate the setup and deployment.

Forrester’s interview with an existing customer and subsequent financial analysis found that the interviewed organization experienced benefits of $13,277,754 over three years versus costs of $6,047,192 adding up to a net present value (NPV) of $7,230,562 and an ROI of 120%.

TEI Framework And Methodology

The TEI methodology helps companies demonstrate, justify, and realize the tangible value of IT initiatives to both senior management and other key business stakeholders.

From the information provided in the interview, Forrester has constructed a Total Economic ImpactTM (TEI) framework for those organizations considering implementing the New Relic Platform.

The objective of the framework is to identify the cost, benefit, flexibility, and risk factors that affect the investment decision. Forrester took a multistep approach to evaluate the impact that the New Relic Platform can have on an organization:

  • DUE DILIGENCE

    Interviewed New Relic stakeholders and Forrester analysts to gather data relative to the New Relic Platform

  • CUSTOMER INTERVIEW

    Interviewed one organization using the New Relic Platform to obtain data with respect to costs, benefits, and risks.

  • FINANCIAL MODEL FRAMEWORK

    Constructed a financial model representative of the interview using the TEI methodology and risk-adjusted the financial model based on issues and concerns of the interviewed organization.

  • CASE STUDY

    Employed four fundamental elements of TEI in modeling New Relic’s impact: benefits, costs, flexibility, and risks. Given the increasing sophistication that enterprises have regarding ROI analyses related to IT investments, Forrester’s TEI methodology serves to provide a complete picture of the total economic impact of purchase decisions. Please see Appendix A for additional information on the TEI methodology.

DISCLOSURES

Readers should be aware of the following:

This study is commissioned by New Relic and delivered by Forrester Consulting. It is not meant to be used as a competitive analysis.

Forrester makes no assumptions as to the potential ROI that other organizations will receive. Forrester strongly advises that readers use their own estimates within the framework provided in the report to determine the appropriateness of an investment in New Relic.

New Relic reviewed and provided feedback to Forrester, but Forrester maintains editorial control over the study and its findings and does not accept changes to the study that contradict Forrester’s findings or obscure the meaning of the study.

New Relic provided the customer name for the interview but did not participate in the interview.


The New Relic Customer Journey

BEFORE AND AFTER THE NEW RELIC INVESTMENT

Interviewed Organization

For this study, Forrester interviewed subject matter experts at a New Relic customer organization that:

  • Is a multibillion-dollar financial services company.

  • Is known for advanced digital innovation and enterprise collaboration.

  • Has over 4,000 employees in IT roles.


Key Challenges

The IT infrastructure leader interviewed for this study described a range of challenges and opportunities that drove this organization’s decision to invest in and implement New Relic’s DevOps measurement tools.

  • Prior tools needed replacement.

    New Relic replaced a collection of tools that had been used for infrastructure and application performance monitoring and incident alerting. The old tools had become largely obsolete. Worse, they were complicated, costly, and used by only a few IT ops staff. “Before [New Relic], DevOps was only Ops. The tool kit wasn’t easy to use; it wasn’t easy to get the data and the views that the developers needed, so they didn’t use the tools. They called the operations folks and had them look at [incidents],” noted an interviewee. “We had two [main] tools; we had synthetics and then we also had basic server monitoring CPU with disk memory-type stats, and that was it. The diagnostics tool was used in very limited areas because everybody was frankly afraid of it, with a lot of performance overhead to their applications. But it was used in just a few apps in production. Only a few people know how to use it. And along with the performance implication, it was expensive, very expensive. So, people just weren’t using the tools. And synthetics usage was even on lighter.”

  • Coverage was limited.

    New Relic tools currently monitor nearly 1,700 applications, with plans for that number to grow to 4,000. Previous tools reviewed only 30 apps at one time, and monitoring tools would be turned off due to heavy compute overhead. Approximately 1,000 end users work with New Relic tools, compared to about 100 IT staff who held active licenses for the old tools.

  • IT strategy needed support.

    The company’s IT strategy includes: 1) reducing the time it takes to get apps into production; 2) carrying out more frequent deployments; 3) automating everything wherever possible; and 4) increasing the use of telemetry to quickly pinpoint and fix problems earlier in the dev cycle. New Relic has been instrumental in making progress against those tenets.

“We use all of the New Relic tools. Our people only used a portion of the previous tool set.”

– Technology planner

“Our old tools were not cutting it. New Relic is a major capability uplift.”

– Technology planner

“The end user experience monitoring was new for us, so to have that browser-level detail was huge.”

– Software development tech consultant


Solution Requirements

The interviewed organization searched for a solution that could offer:

  • End-to-end views of development and operations.

    With the capability to drill down from browser to app to server and into the infrastructure, to analyze and resolve performance issues anywhere, but especially early in the development process.

  • Ease of use.

    so that end users could make sense of the tools and teams could share them.

  • Always-on telemetry.

    which is a huge improvement over monitoring tools that are switched on only periodically.

  • Portability.

    meaning a tool that is easy to move along with applications, such as from on-premises to a cloud-computing platform, and back, without any kind of refactoring or any kind of new infrastructure.

  • Low compute overhead.

    without causing problems or conflicts with the applications being monitored.

After gathering requirements, an extensive request for proposal (RFP) and proof-of-concept (POC) process evaluating multiple vendors, the interviewed organization chose New Relic and began deployment.


Key Results

The interview and analysis revealed several key results from the New Relic investment:

  • New Relic led to a 30% reduction in MTTR.

    Mean-time-to-resolution dropped significantly. While the previous tools typically required a ticket and a team to fix a problem, the New Relic tools offer immediate views and involve fewer people. Now development and/or operations teams can zero in on the problem and engage only those needed. This allows many IT staff to redirect their efforts toward the business instead of the infrastructure and apps.

  • New Relic eliminated the need to scale company’s on-premises infrastructure.

    New Relic’s cloud provisioning removes the need to plan, purchase, and manage compute and storage resources.

  • New Relic enabled the company to achieve its four pillars of DevOps.

    New Relic has been an asset for making progress on the company’s stated goals for its DevOps organization: 1) reduce the time it takes to get apps into productions; 2) deliver more frequent deployments; 3) automate wherever possible; and 4) use telemetry to locate and fix problems quickly.

  • New Relic is now considered a must-have for all new applications.

    After seeing New Relic’s value to the company’s DevOps organization, the company is rolling the solution out to all corners of the IT environment. “[The ubiquity of New Relic] was one of the big draws for us,” noted the interviewee for this study. “The visibility that people had never had before, with always-on telemetry... Before, we only had spotty telemetry. If you wanted an infrastructure metric, you had to put in a request, if it was beyond the very basics: CPU, disk, and memory. New Relic has become more of as-a-service because telemetry is always on; it’s always there. It’s easy to use; the panels seem more developer-centric with somewhat less emphasis on infrastructure and operations, but teams can share the tool. Both Dev and Ops get value, and we’re both on the same page. Before, it was siloed, and only a few teams used the tools.”

“Everybody is using New Relic. Heck, I’ve got managers using it. They can go in and look at the dashboard and see how well their application’s doing. We’ve got business users using it now where we put some business metrics into a dashboard. So, I mean, it’s even gone beyond Dev and Ops.”

– Software development tech consultant

“New Relic is like antivirus software. It’s now required for all new apps.”

– Software development tech consultant


Analysis Of Benefits

QUANTIFIED BENEFIT DATA

Total Benefits

Ref. Benefit Year 1 Year 2 Year 3 Total Present Value
Atr Labor resources reassigned (MTTR cost savings) $1,989,000 $2,983,500 $2,983,500 $7,956,000 $6,515,432
Btr Decommissioned tools $900,000 $2,250,000 $2,700,000 $5,850,000 $4,706,236
Ctr Labor resources reassigned (decommissioned tool maintenance) $425,000 $850,000 $850,000 $2,125,000 $1,727,461
Dtr Scalability (infrastructure cost avoidance) $90,000 $135,000 $180,000 $405,000 $328,625
Total benefits (risk-adjusted) $3,404,000 $6,218,500 $6,713,500 $16,336,000 $13,277,754

The table above shows the total of all benefits across the areas listed below, as well as present values (PVs) discounted at 10%. Over three years, the interviewed organization expects risk-adjusted total benefits to be a PV of more than $13.3 million.


Labor Resources Reassigned (MTTR Cost Savings)

When asked about the value of New Relic to this organization, the IT leader interviewed for this study explained: “The big one is MTTR. That’s because the prior tools required a ticket, and you had to engage another team, and it took much longer to reduce or to resolve an issue. So, after we dropped in New Relic, everybody, whoever needs it, has visibility into the applications, so we were able to reduce MTTR. That’s mostly labor. It’s the number of people who aren’t involved or involved for a much shorter period.

“Before New Relic, we called in everyone to fix an incident,” he continued. “You were guilty until you prove yourself innocent. We would have everybody on the phone and in the room until we figured out where the root cause was. Now, with New Relic, we can zoom in on where the problem is and only engage the folks that need to be engaged.”

Related to this benefit category:

  • All-hands emergency “Crit Sit” problem resolution sessions dropped from 1200 to 800 per year.

  • The number of incidents dropped by 30% Year 2 of the New Relic implementation.

  • The average time-to-resolve incidents dropped.

  • Overall reduction in resolution costs was estimated at 30%.

“Now, we always get only the right people . . . because with New Relic, we can tell if SQL performance is declining, and we can engage the Oracle teams, or we can tell that external services are running slowly so we might engage our SOA team,” explained one of the software development tech consultants who is now helping the organization realize New Relic DevOps benefits.

The table below shows the assumptions and calculations for this benefit category.

  • Many members of the IT organization were involved in the resolution of each “Crit Sit.” Involvement could range from 15-30 individuals for each event.

  • The number of incidents avoided increased from 8 to 12 in Year 2.

  • Incidents formerly took 5 hours to resolve.

  • IT compensation was $75.00 per hour ($150,000 fully loaded annual compensation).

Avoided costs related to MTTR reductions will depend on:

  • The number and complexity of apps covered by New Relic.

  • Number of IT staff involved in the resolution “Crit Sit” event.

  • The average fully burdened salary (seniority) of IT staff involved.

To account for these risks, Forrester adjusted this benefit downward by 15%, yielding a three-year risk-adjusted total PV of $6,515,432.

Impact risk is the risk that the business or technology needs of the organization may not be met by the investment, resulting in lower overall total benefits. The greater the uncertainty, the wider the potential range of outcomes for benefit estimates.

Labor Resources Reassigned (MTTR Cost Savings): Calculation Table

Ref. Metric Calc. Year 1 Year 2 Year 3
A1 Hours per incident saved across IT teams 75 75 75
A2 Average incidents per week prior to New Relic 23 23 23
A3 Average incidents per week with New Relic 30% decrease in Year 2
Source: customer interview
15 11 11
A4 Average incidents avoided per week A2-A3 8 12 12
A5 Average hours per incident saved A1*A4 600 900 900
A6 Fully loaded hourly compensation $75.00 $75.00 $75.00
At Labor resources reassigned (MTTR cost savings) A5*A6*52 $2,340,000 $3,510,000 $3,510,000
Risk adjustment ↓15%
Atr Labor resources reassigned (MTTR cost savings) (risk-adjusted) $1,989,000 $2,983,500 $2,983,500

Decommissioned Tools

Prior to implementing New Relic, the company employed tools for synthetics, basic server monitoring for CPU and disk monitoring metrics, and some limited diagnostics for a few apps in the production environment. “Everybody was afraid of the old tools,” explained the DevOps technology planner interviewed for this study. “The few staff who knew how to use the tools were afraid of the performance overhead to their applications. Put it all together, and the people just weren’t using the tools.”

The organization was able to decommission old tools and reallocate those license, maintenance, and labor operating expenses to other needs in the organization.

For the interviewed organization, Forrester assumes that the old tools is able to fully decommissioned by the end of Year 2.

The reduction in software development expense will vary with:

  • The rate at which decommissioning takes place versus plan.

  • The staff levels needed to disengage old tools.

  • Communications and setting expectations with tool owners and users.

To account for these risks, Forrester adjusted this benefit downward by 10%, yielding a three-year risk-adjusted total PV of $4,706,236 million.

Decommissioned Tools: Calculation Table

Ref. Metric Calc. Year 1 Year 2 Year 3
Bt Decommissioned tools (licenses, maintenance) Est. based on interviews $1,000,000 $2,500,000 $3,000,000
Risk adjustment ↓10%
Btr Decommissioned tools (risk-adjusted) $900,000 $2,250,000 $2,700,000

Labor Resources Reassigned (Decommissioned Tool Maintenance)

After rolling out New Relic, the company has saved the cost of IT labor because staff no longer need to feed and care for high-maintenance tools, as described above, for synthetics, basic server monitoring for CPU and disk monitoring metrics, and some limited diagnostics for a few apps in the production environment. “On the I&O side, they used to spend a lot of time with messing with the infrastructure, dealing with the hardware and keeping the software current, maintenance — regular maintenance that they had to do with the old tool ‘suite.’ That’s now gone away, so they’re not doing that anymore. It’s all software-as-a-service. They’re more focused on getting the business value out of the tool. So they’re doing training sessions, they’re helping with synthetic scripts, they’re helping to guide the applications on how to further instrument to get more value out of the APM data. So they’re building dashboards. They’re doing a lot of different things, but it’s more business value out of it versus maintenance of the software and hardware.”

For the interviewed organization, Forrester assumes that the old tools were fully decommissioned by the end of Year 2.

The reduction in maintenance labor expense will vary because:

  • Decommissioning might not take place as quickly as planned.

  • Estimated compensation could be higher than for those performing these maintenance tasks.

To account for these risks, Forrester adjusted this benefit downward by 15%, yielding a three-year risk-adjusted total PV of $1,727,461.

Labor Resources Reassigned (Decommissioned Tool Maintenance)

Ref. Metric Calc. Year 1 Year 2 Year 3
C1 Number of IT staff 5 10 10
C2 Yearly rate per person $100,000 $100,000 $100,000
Ct Labor resources reassigned (decommissioned tool maintenance) C1*C2 $500,000 $1,000,000 $1,000,000
Risk adjustment ↓15%
Ctr Labor resources reassigned (decommissioned tool maintenance) (risk- adjusted) $425,000 $850,000 $850,000

Scalability (Infrastructure Cost Avoidance)

With the adoption of New Relic, client organizations no longer need to plan, purchase, or maintain on-premises infrastructure for their DevOps monitoring tools. New Relic is on point for accommodating and expanding this infrastructure. For this benefit category, Forrester assumes that the company avoided 10, 15, and 20 compute/storage devices over the three years, at an annual fully loaded (purchase, license, maintenance, etc.) cost of $10,000 each.

To account for any risk of overestimating this benefit, Forrester adjusted this benefit downward by 10%, yielding a three-year risk-adjusted total PV of $328,625.

Scalability (Infrastructure Cost Avoidance): Calculation Table

Ref. Metric Calc. Year 1 Year 2 Year 3
D1 Number of on-premises storage/compute devices Interviews 10 15 20
D2 Cost per device Assumption $10,000 $10,000 $10,000
Dt Scalability (infrastructure cost avoidance) D1*D2 $100,000 $150,000 $200,000
Risk adjustment ↓10%
Dtr Scalability (infrastructure cost avoidance) (risk- adjusted) $90,000 $135,000 $180,000

Unquantified Benefits

This study attempts to quantify those benefits that were most compellingly articulated by the New Relic customer that participated in the research. Some benefits, described below, are more speculative and may be evaluated and quantified in the future as the organization gains more experience with New Relic.

  • Better business decisions.

    When application owners can see the paths that their customers are taking to reach and navigate through an app, they can focus on that behavior and more intelligently choose where to prioritize their work. For example, one of the teams recounted how it can determine the specific path that users take through an app. In one instance, the business wanted the team to do a customer-facing project, but using the browser monitoring, the IT team found that it was related to an infrequently used path through the application, and the cost to do the enhancement would not get the return on investment that the business expected. By using the metrics that New Relic provides, companies can drive good business decisions.

  • Lower frustration, greater job satisfaction.

    When a New Relic customer replaces legacy tools and amends DevOps processes, IT staff benefit from an enriched platform from which to serve their customers. These employees can be more efficient and effective, and thus gain greater job satisfaction due to a simplified, more intelligent, more satisfying, and less frustrating DevOps work environment. Automation reduces the strain and allows staff to focus on business value and business results. The likely result is lower frustration, greater job satisfaction, higher retention, and lower cost of recruiting and replacing staff.

  • Happy customers through shorter lead times for new features.

    The financial services company described an example of customer experience enhancement via New Relic in the form of a feature related to quoting and binding insurance coverage for the company’s insured customers. A new app can show the flow from start of quote, through multiple points in the process, to how many people bind new insurance coverage. “It’s very cool to be able to see it in real time and without any additional instrumentation in your application or anything like that. We can just watch it in New Relic, and when we know more about our customer, we can offer more and better service and products.” More examples and demonstrations of value in the customer experience domain can be exploited in the future.


Flexibility

The value of flexibility is clearly unique to each customer, and the measure of its value varies from organization to organization. There are multiple scenarios in which a customer might choose to implement New Relic and later realize additional uses and business opportunities, including:

  • Cloud migration.

    In addition to the myriad of benefits offered through the implementation of New Relic for DevOps, further involving New Relic in organizational processes can pay even more dividends. Including New Relic in application production and in cloud migration extends optimization of application performances. According to New Relic, use of this service can accelerate the time it takes to bring an application to the “run” phase of migration and leads to infrastructure and engineering cost reductions. Organizations achieve this by equipping customers with a comprehensive view of each app’s migration path using various dashboards, tools, and metrics. These views allow customers to more easily evaluate each app’s migration path and oversee the deployment of the app while also monitoring the performance and operation of each project. A holistic view of application migration expounds on the insights provided by the DevOps platform and allows for further improvements in process efficiencies.

  • Enhancing customer experience.

    The next area of value realization from the changes in this company’s DevOps and digital transformation efforts will be customer experience. Even at this stage of the company’s experience with New Relic, the company has seen several examples of customer experience enhancement. “We wouldn’t do all this if we weren’t doing it for our customers or suppliers,” said one interviewee. “For example, we are automating everything, so we can free up our people to do higher-level stuff that’s going to result in more competitive decisioning, better and more products, less chance of human error, and taking cost out of our businesses. And if the chairman wants to double the size of one of our businesses, well, New Relic is going to help us do that.” Another example: The claims department built a new product during a recent natural catastrophe, adding a new feature and functionality into a customer-facing app and rolling it out into production in one day. Previously the same feat would have taken months. “We’ve definitely moved the needle, and New Relic is part of that,” noted the interviewee.

Flexibility would also be quantified when evaluated as part of a specific project (described in more detail in Appendix A).

Flexibility, as defined by TEI, represents an investment in additional capacity or capability that could be turned into business benefit for a future additional investment. This provides an organization with the "right" or the ability to engage in future initiatives but not the obligation to do so.


Analysis Of Costs

QUANTIFIED COST DATA AS APPLIED TO THE COMPOSITE

Total Costs

Ref. Cost Initial Year 1 Year 2 Year 3 Total Present Value
Etr New Relic usage fees $0 $1,500,000 $2,000,000 $2,500,000 $6,000,000 $4,894,816
Ftr New Relic setup costs $862,500 $34,500 $34,500 $0 $931,500 $922,376
Gtr Professional services from New Relic $230,000 $0 $0 $0 $230,000 $230,000
Total costs (risk-adjusted) $1,092,500 $1,534,500 $2,034,500 $2,500,000 $7,161,500 $6,047,192

The table above shows the total of all costs across the areas listed below, as well as present values (PVs) discounted at 10%. Over three years, the interviewed organization expects risk-adjusted total costs to be a PV of more than $6.0 million.


New Relic Usage Fees

$4.9 million over three years, 81% of total costs

The annual cost of using New Relic for the interviewed organization started at $1.5 million in Year 1 and increased as the number of apps and usage throughout the company grew through Year 3. The company currently employs the entire suite of the New Relic Platform components, including Application Performance Monitoring, Browser, Mobile, Synthetics, Insights, Infrastructure, and Radar. “We wanted the complete picture. And we’re not going to use one tool for this and then go find a different vendor for another tool. It becomes more economical and easier to train people by using one package,” noted the tech planner.

As of this writing, the company was still rolling out New Relic, so coverage is growing every week. Prior to New Relic, the old tool coverage included about 30 apps instrumented with some APM-like detail running part time. In Year 1 the company has 1,700 applications with APM running all the time, and will increase monitoring to 4,000 applications by Year 3, which is reflected in the pricing below.

As this fee is set by contract and therefore known in advance, uncertainty is low, and thus Forrester did not risk adjust this cost category. The three-year total PV is $4,894,816.

New Relic Usage Fees: Calculation Table

Ref. Metric Calc. Initial Year 1 Year 2 Year 3
E1 License fees to New Relic $1,500,000 $2,000,000 $2,500,000
Et New Relic usage fees E1 $0 $1,500,000 $2,000,000 $2,500,000
Risk adjustment 0%
Etr New Relic usage fees (risk- adjusted) $0 $1,500,000 $2,000,000 $2,500,000

New Relic Setup Costs

To enable the initial setup and subsequent rollout of New Relic inside the financial services giant profiled in this study, the organization assigned a team of 10 mid- and senior-level IT resources to this initiative for the first six months. Fewer senior resources were required thereafter even as the number of apps monitored by New Relic Platform grew toward a total of 4,000.

Initial efforts focused on the conversion from the previous synthetics to the New Relic Synthetics, requiring some rework of scripting. “That was our biggest effort in the migration,” explained the interviewee. “Everything else is pretty easy.”

To quantify this cost category, Forrester assumes, based on the interviews, that 10 IT staff earning a fully loaded compensation of $75.00 per hour ($150,000 annually including benefits) were focused full time for six months on the rollout of New Relic to various areas of the company. This effort continued at a lower level of staff commitment through Year 2. This is now a centralized group in the infrastructure and operation area. Given the amount of automation employed, the team is efficient; it isn’t manually installing any software.

Ten FTEs for setup, onboarding for six months

The implementation risks with this cost category are several:

  • The effort could face unanticipated delays, complexities, and surprises requiring more time than estimated.

  • The effort could pull in more senior IT leaders, increasing the estimated hourly cost.

  • Adoption of New Relic could require more stakeholder communication and training than anticipated.

To account for these risks, Forrester adjusted this cost upward by 15%, yielding a three-year risk-adjusted total PV of $922,376.

New Relic Setup Costs

Ref. Metric Calc. Initial Year 1 Year 2 Year 3
F1 Number of IT FTEs 10 2 2
F2 Hourly rate per person $75.00 $75.00 $75.00
F3 Hours 1,000 200 200
Ft New Relic setup costs F1*F2*F3 $750,000 $30,000 $30,000 $0
Risk adjustment ↑15%
Ftr New Relic setup costs (risk- adjusted) $862,500 $34,500 $34,500 $0

Implementation risk is the risk that a proposed investment may deviate from the original or expected requirements, resulting in higher costs than anticipated. The greater the uncertainty, the wider the potential range of outcomes for cost estimates.


Professional Services From New Relic

During the implementation and initial application onboarding period, the company in this study engaged services from New Relic amounting to one consultant working full time for six months. This resource from New Relic was available to provide program management, answer questions, and liaise with colleagues and subject matter experts at New Relic. This cost was easy to justify since one of the benefits was to decommission the old tools faster than would have been the case without help, and thereby avoid having to re-up and pay the license fees on old tools again. This assistance from New Relic also sped up the work of scripting synthetics and enabled an earlier start on consulting with applications, getting more APM coverage and several integrations, and getting New Relic ingrained into the development life cycle.

Unexpected complexities, delays, or unanticipated challenges could prolong the efforts and work schedule of this outside resource. To account for these risks, Forrester adjusted this cost upward by 15%, yielding a three-year risk-adjusted total PV of $230,000.

Professional Services From New Relic: Calculation Table

Ref. Metric Calc. Initial Year 1 Year 2 Year 3
G1 Number of people Interviews 1
G2 Hourly rate per person $200.00
G3 Hours 6 months 1,000
Gt Professional services from New Relic G1*G2*G3 $200,000 $0 $0 $0
Risk adjustment ↑15%
Gtr Professional services from New Relic (risk-adjusted) $230,000 $0 $0 $0

Financial Summary

CONSOLIDATED THREE-YEAR RISK-ADJUSTED METRICS
  • These risk-adjusted ROI, NPV, and payback period values are determined by applying risk-adjustment factors to the unadjusted results in each Benefit and Cost section.

Cash Flow Chart (Risk-Adjusted)

Cash Flow Table (Risk-Adjusted)

Initial Year 1 Year 2 Year 3 Total Present Value
Total Costs ($1,092,500) ($1,534,500) ($2,034,500) ($2,500,000) ($7,161,500) ($6,047,192)
Total Benefits $0 $3,404,000 $5,887,000 $7,045,000 $16,180,000 $13,277,754
Net Benefits ($1,092,500) $1,869,500 $3,852,500 $4,545,000 $9,174,500 $7,230,562
ROI 120%
Payback period 8.0

The financial results calculated in the Benefits and Costs sections can be used to determine the ROI, NPV, and payback period for the interviewed organization’s investment. Forrester assumes a yearly discount rate of 10% for this analysis.

The New Relic Platform: Overview

The following information is provided by New Relic. Forrester has not validated any claims and does not endorse New Relic or its offerings.

New Relic empowers software teams with the real-time insights they need to overcome complexity and risk, innovate faster, and seize massive digital opportunity. New Relic is the catalyst for digital transformation, helping you accelerate the pace of innovation. The New Relic Platform is the only solution that is completely cloud-based in its category, installs and delivers value in minutes, depicts the entire stack in a single curated UI, and scales across your whole organization.

Key digital imperatives:
  • Prepare for digital moments of truth.
  • Prepare for major events and incidents.
  • Connect technical performance to business value.
  • Resolve customer-facing issues in moments that matter.
Make DevOps work:
  • Get real-time feedback on impact of deployments.
  • Get instant alerts when issues impact customer experience.
  • Unify disconnected disparate teams.
Accelerate cloud adoption:
  • Analyze application structure and performance.
  • Identify and resolve issues fast.
  • Optimize performance and spend of your cloud environment.
The New Relic Platform includes:
  • New Relic Browser: Sharpen your front-end performance.
  • New Relic Mobile: Optimize iOS and Android apps.
  • New Relic Synthetics: Simulate real user behavior.
  • New Relic APM: Monitor your applications in real time.
  • New Relic Infrastructure: Manage your back-end environments.
  • New Relic Insights: See your entire stack in a single curated UI.

This study was conducted by Forrester’s Custom Content Consulting Practice. Get in touch to discuss your custom content needs and goals. And to learn more about all of Forrester's consulting capabilities, click here.

Appendix

Appendix A: Total Economic Impact

Total Economic Impact is a methodology developed by Forrester Research that enhances a company’s technology decision-making processes and assists vendors in communicating the value proposition of their products and services to clients. The TEI methodology helps companies demonstrate, justify, and realize the tangible value of IT initiatives to both senior management and other key business stakeholders.

Total Economic Impact Approach

  • Benefits represent the value delivered to the business by the product. The TEI methodology places equal weight on the measure of benefits and the measure of costs, allowing for a full examination of the effect of the technology on the entire organization.

  • Costs consider all expenses necessary to deliver the proposed value, or benefits, of the product. The cost category within TEI captures incremental costs over the existing environment for ongoing costs associated with the solution.

  • Flexibility represents the strategic value that can be obtained for some future additional investment building on top of the initial investment already made. Having the ability to capture that benefit has a PV that can be estimated.

  • Risks measure the uncertainty of benefit and cost estimates given: 1) the likelihood that estimates will meet original projections and 2) the likelihood that estimates will be tracked over time. TEI risk factors are based on “triangular distribution.”

  • PRESENT VALUE (PV)

    The present or current value of (discounted) cost and benefit estimates given at an interest rate (the discount rate). The PV of costs and benefits feed into the total NPV of cash flows.

  • NET PRESENT VALUE (NPV)

    The present or current value of (discounted) future net cash flows given an interest rate (the discount rate). A positive project NPV normally indicates that the investment should be made, unless other projects have higher NPVs.

  • RETURN ON INVESTMENT (ROI)

    A project’s expected return in percentage terms. ROI is calculated by dividing net benefits (benefits less costs) by costs.

  • DISCOUNT RATE

    The interest rate used in cash flow analysis to take into account the time value of money. Organizations typically use discount rates between 8% and 16%.

  • PAYBACK PERIOD

    The breakeven point for an investment. This is the point in time at which net benefits (benefits minus costs) equal initial investment or cost.

The initial investment column contains costs incurred at “time 0” or at the beginning of Year 1 that are not discounted. All other cash flows are discounted using the discount rate at the end of the year. PV calculations are calculated for each total cost and benefit estimate. NPV calculations in the summary tables are the sum of the initial investment and the discounted cash flows in each year. Sums and present value calculations of the Total Benefits, Total Costs, and Cash Flow tables may not exactly add up, as some rounding may occur.