January 2021

The Total Economic Impact™ Of Palo Alto Networks For Network Security And SD-WAN

Cost Savings And Business Benefits Enabled By Palo Alto Networks NGFWs, Cloud-Delivered Security Services, IoT Security, And Prisma SD-WAN

As businesses push more data and applications into the cloud and the workforce demands more flexibility and remote working options, IT and security professionals are tasked with keeping the increasingly complicated infrastructure connected and secure from both outside and inside threats. A key step in this journey is implementing a centralized solution for users, applications, data, networks, and devices regardless of where they reside.

Palo Alto Networks commissioned Forrester Consulting to conduct an objective Total Economic Impact™ (TEI) study and examine the potential return on investment (ROI) enterprises realize when deploying Palo Alto Networks for network security SD-WAN.The purpose of this study is to provide readers with a framework to evaluate the potential financial impact of Palo Alto Networks’ products on their organizations. These products include next-generation firewalls (NGFWs), Cloud-Delivered Security Services including internet-of-things (IoT) security, and Prisma software-defined wide-area network (SD-WAN).

Palo Alto Networks network security and SD-WAN solutions help organizations centralize management, maintain optimum connectivity, and extend security policies and controls to every user, application, and device.

For a short description of the Palo Alto Networks solutions discussed in this study, please refer to the Product Glossary after the final page of the report.

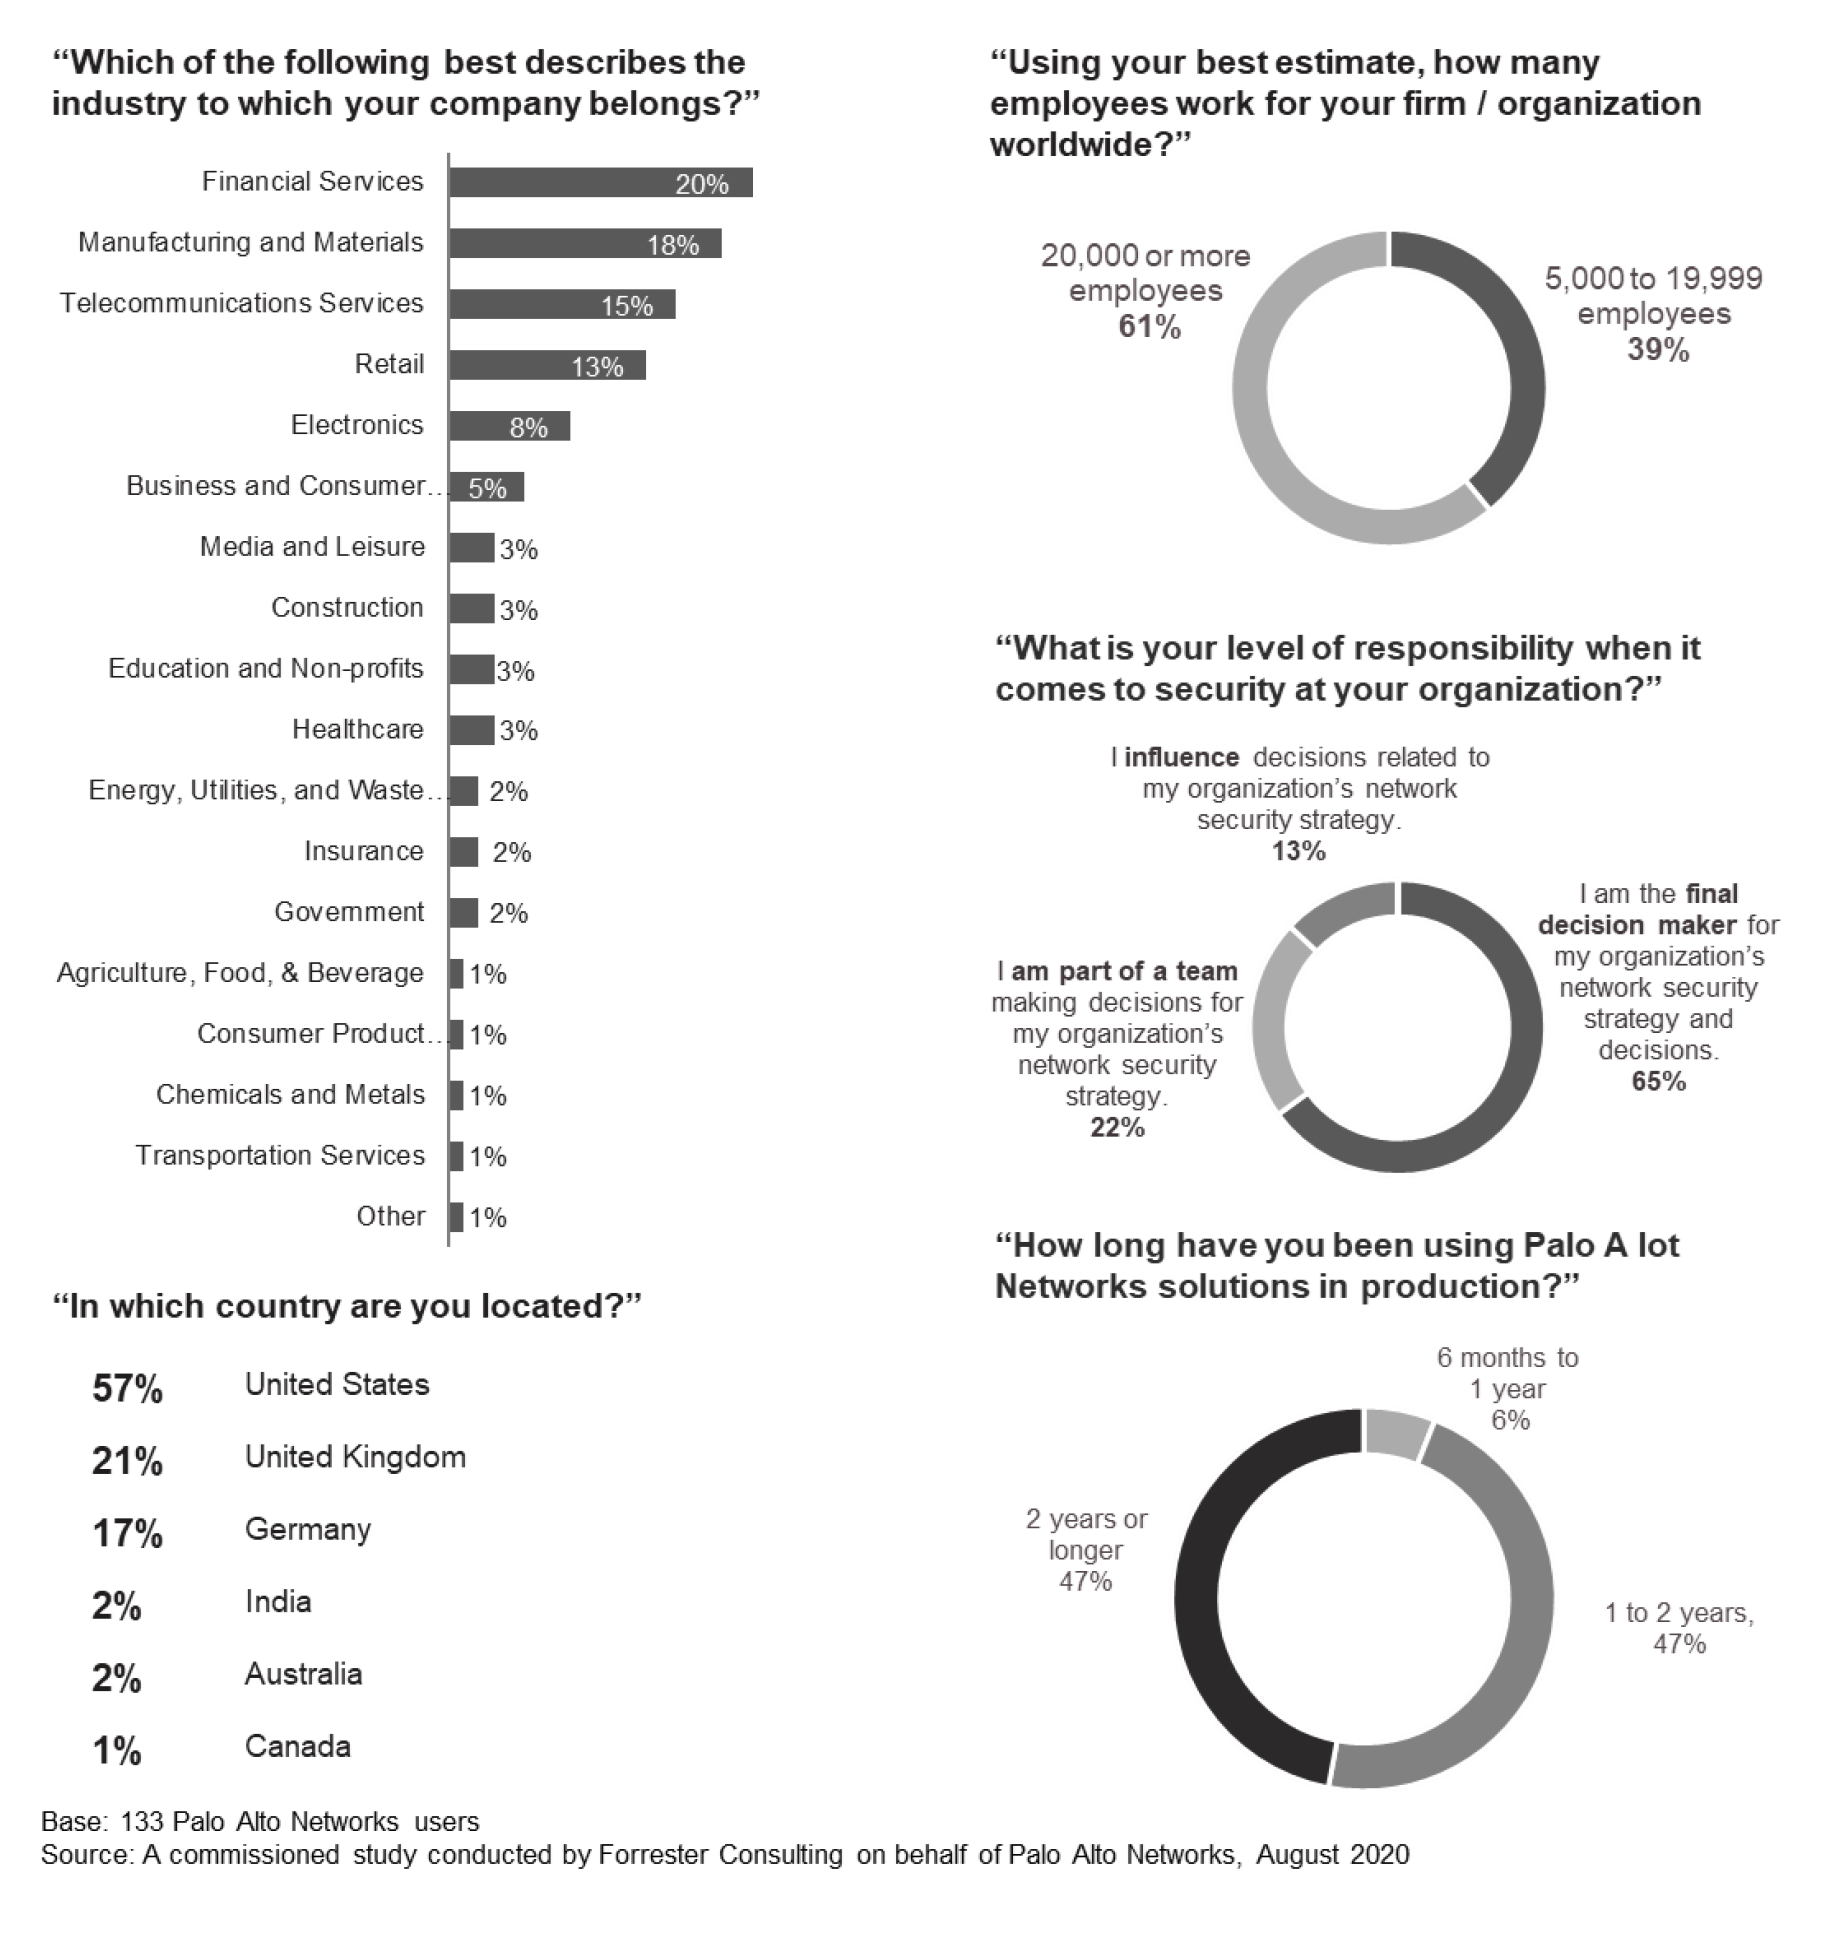
To better understand the benefits, costs, and risks associated with this investment, Forrester interviewed nine customers and surveyed 133 customers with experience using Palo Alto Networks solutions. For the purposes of this study, Forrester aggregated the experiences of the interviewed and surveyed customers and combined the results into a single composite organization.

Prior to deploying Palo Alto Networks for network security needs, the customers leveraged traditional firewalls with point solutions to secure their environments. This was a byproduct of digital transformation efforts. The organizations lacked modern security technology as security and IT teams tried to keep up with evolving business needs. Digital transformation initiatives pushed more data, applications, and processes to the cloud while other core business functions remained on-premises. Adding to the complexity was the need for the organizations to support more flexible and remote work options for their employees as employee expectations and other environmental factors drove up demand for remote access to critical applications and data. This piecemeal approach left organizations with as many as 17 different vendors in their security stacks, and made it challenging for security operations (SecOps) teams to integrate technologies, benefit from analytics, apply consistent policies, and deliver a consistent experience to end users.

Additionally, the lack of a unified platform and next-generation firewall capabilities left the organizations stuck in a cycle of devoting valuable resources to management, operations, and maintenance activities while work on new initiatives and enhancements fell to the wayside.

After the investment in the Palo Alto Networks network security solution, the customers had a common platform that fed into a centralized tool: Palo Alto Networks’ security management solution, Panorama. This significantly reduced investigational effort and freed up valuable resources to focus on enhancements and securing more of the network. The interviewees’ organizations deployed some or all of these network security and SD-WAN solutions from Palo Alto Networks.

Key results from the investment are highlighted by: efficiency gains for IT, security, and networks operations teams, business end users, and in-store workers; a reduced likelihood of a data breach with the enablement of Zero Trust; reduced costs associated with licensing and managing legacy point-solution infrastructure; and improvements to both IoT Security and SD-WAN capabilities.

Consulting Team:
  • Nicholas Ferrif,
  • Henry Huang,
  • Japser Narvil

Project Contributors:

Key Statistics

  • Return on investment (ROI)

    247%

  • Net present value (NPV)

    $28.5M

Key Financial Findings

  • ROI
    247%
  • Benefits PV
    $40.1M
  • NPV
    $28.5M
  • Payback
    6 months
Number of employees relocated due to WildFire

2 FTEs

Quantified projected benefits. Risk-adjusted present value (PV) quantified benefits include:

  • Reduced number of security incidents requiring manual investigation by 35%, decreased mean-time-to-resolution (MTTR) by 20%, and reduced number of end point devices requiring reimaging, all resulting in $5.1 million saved over three years.

    Deploying Palo Alto Networks security solutions significantly improved visibility into the organizations’ networks and introduced automation capabilities that drove down the number of critical alerts, including false positives, over time. Additionally, the organizations were able to reduce MTTR because analysts now had the data they needed at their fingertips. As a result, there were fewer malware infections and other issues with end point devices, reducing the workload for the IT operations team.

  • Improved end-user productivity with fewer incidents and investigations, totaling $865,226 over three years.

    With Palo Alto Networks security solutions, end users spend less time interacting with the security and IT operations teams, and they spend more time focusing on their primary roles and driving value for their organizations.

  • Decreased likelihood of a data breach by 45% after three years.

    With Palo Alto Networks, the organizations were able to enact a Zero Trust security model and apply consistent security policies across the entire organization. Cloud-Delivered Security Services supplemented the existing SecOps team and added 24/7 monitoring, vulnerability and threat prevention, and support.

  • Avoided and rationalized security infrastructure, saving $9.9 million over three years.

    The organizations removed legacy security systems and products after deploying Palo Alto Networks. With as many as 17 vendors in their security stacks prior to investing, simplifying the environment and reducing the number of vendors was a priority, and the Palo Alto Networks solution provided superior coverage with less overhead. Some of the technologies that were supplanted by Palo Alto Networks include intrusion prevention (IPS/IDS), secure web gateway (SWG), web proxy, VPN malware analysis (e.g., sandboxing), DNS, and software-as-a-service (SaaS) application security.

  • Reallocated roughly 50% full-time security professionals to higher-value initiatives due to management efficiencies from a common platform, saving $1.9 million over three years.

    Removing legacy vendors and consolidating to a common platform meant fewer people were required to perform the same tasks, allowing the organizations to reduce their management teams by roughly half. Additionally, the common platform allowed the organizations to quickly roll out updates, patches, and security policies to the entire platform from a centralized location, rather than updating each security device manually.

  • Saved $1.4 million on IoT from reduced management effort and a reduction in the number of new IoT devices purchased.

    With IoT Security, the organizations were able to identify and secure all their IoT devices from a central platform, quickly understand the health and location of each device, and maximize the value and utilization of each device with the enhanced reporting capabilities. This reduced new purchases by 10%.

  • Reduced time to achieve proper security posture by 30%, saving $812,860 over three years.

    By leveraging Palo Alto Networks’ NGFWs and Cloud-Delivered Security Services, the organizations were able to stand up their security solutions faster and reach steady state more quickly. This gave the security teams a head start on optimizing the solution to the Zero Trust standards compared to using point solutions.

  • Cut costs on WAN hardware and connectivity at remote sites by over 90%, representing $6.04 million over three years.

    By migrating away from multiprotocol label switching (MPLS) to Palo Alto Networks Prisma SD-WAN, the organizations were able to significantly reduce monthly operating costs at their sites while improving visibility and control of network traffic.

  • Reduced management effort by half for IT teams and improved efficiency of branch office and retail store workers by 12% with Prisma SD-WAN, saving $4.9 million over three years.

    With an intuitive UI and purpose-built hardware, Prisma SD-WAN enabled centralized management of the SD-WAN for IT teams. Additionally, the improved bandwidth, network performance, and security controls allowed the organizations to deploy better technology to their remote workers, improving productivity and customer experience.

“The firewalls are top of the line. You can get speed to value very quickly, and the ability to increase your security posture while enabling the business is second to none.”

— Network security manager, retail

Reduction in security incidents needing advanced investigations

35%

Decreased likelihood of a data breach after 3 years

45%

Unquantified benefits. Benefits that are not quantified for this study include:

  • Using fewer vendors and systems allowed security professionals to invest in individual skill sets.

    A VP of cybersecurity in the entertainment industry said: “We’ve been able to focus our standard training on the core Palo Alto Networks capabilities. So, once finished, our team can use their leftover time to take a certificate training. That’s something that can actually grow their career rather than [making them] simply tread water trying to keep up with 10 different solutions.”

  • Increased employee retention.

    A CISO in the retail industry explained: “We wanted to figure out how this technology could be used as a retention tool. Can I attract great talent by telling them we have Palo Alto Networks technology and allowing them to build their skill set and increase marketability? Absolutely. Without a doubt. I’ve actually confirmed that in one-on-ones with junior and senior resources on my team. Going with Palo Alto Networks has also bought me some credibility points with my own management. So, on top of helping attract and retain talent, it’s actually made me look good, too.”

Costs. Risk-adjusted PV costs include:

  • Installation and deployment costs totaling $3.4 million over three years.

    Time and labor are required to deploy and install all the various components of the Palo Alto Networks solution (including physical and virtual NGFWs) and to bring Prisma SD-WAN to 350 sites.

  • Training costs totaling $156,000 over three years.

    Palo Alto Networks required less training than the legacy solutions, and interviewees and respondents reported that the provided trainings were more effective and efficient, allowing employees to get up to speed faster and expand their skill sets.

  • Palo Alto Networks hardware, licensing, and Cloud-Delivered Security Services costs totaling $6.7 million over three years.

    The organizations were able to purchase hardware up front and leverage three-year contract terms to add the Cloud-Delivered Security Services, helping reduce the overall costs of NGFW, IPS/IDS, SWG, web proxy, VPN, URL Filtering, malware analysis (e.g., sandboxing), and DNS, SaaS application, and IoT Security solutions. Additionally, deploying services like Prisma Access allows the Cloud-Delivered Security Services to be extended for branch offices or remote workers, and organizations can scale up and down based on usage and needs.

  • SD-WAN deployment costs totaling $1.2 million over three years.

    The organizations used a phased deployment strategy for their SD-WAN upgrades, leveraging end-of-life cycles to replace in-store hardware. Negotiating WAN connectivity costs for all sites with the same provider also gave the organizations leverage to further reduce the monthly operating costs at each site.

The financial analysis based on the customer interviews and survey found that a composite organization experiences benefits of $40.1 million over three years versus costs of $11.5 million. This adds up to a net present value (NPV) of $28.5 million and an ROI of 247% that sees payback within six months of purchase.


TEI Framework And Methodology

From the information provided in the interviews and survey, Forrester constructed a Total Economic Impact™ framework for those organizations considering an investment in the Palo Alto Networks network security and SD-WAN solution.

The objective of the framework is to identify the cost, benefit, flexibility, and risk factors that affect the investment decision. Forrester took a multistep approach to evaluate the impact that Palo Alto Networks can have on an organization.

  • DUE DILIGENCE

    Interviewed Palo Alto Networks stakeholders and Forrester analysts to gather data.

  • CUSTOMER INTERVIEWS AND SURVEY

    Interviewed nine decision-makers and surveyed 133 decision-makers at organizations using Palo Alto Networks to obtain data with respect to costs, benefits, and risks.

  • COMPOSITE ORGANIZATION

    Designed a composite organization based on characteristics of the interviewed and surveyed organizations.

  • FINANCIAL MODEL FRAMEWORK

    Constructed a financial model representative of the interviews and survey using the TEI methodology and risk-adjusted the financial model based on issues and concerns of the interviewed organizations.

  • CASE STUDY

    Employed four fundamental elements of TEI in modeling the investment impact: benefits, costs, flexibility, and risks. Given the increasing sophistication of ROI analyses related to IT investments, Forrester’s TEI methodology provides a complete picture of the total economic impact of purchase decisions. Please see Appendix A for additional information on the New Tech TEI methodology.

DISCLOSURES

Readers should be aware of the following:

This study is commissioned by Palo Alto Networks and delivered by Forrester Consulting. It is not meant to be used as a competitive analysis.

Forrester makes no assumptions as to the potential ROI that other organizations will receive. Forrester strongly advises that readers use their own estimates within the framework provided in the report to determine the appropriateness of an investment in the NGFW.

Palo Alto Networks reviewed and provided feedback to Forrester, but Forrester maintains editorial control over the study and its findings and does not accept changes to the study that contradict Forrester’s findings or obscure the meaning of the study.

Palo Alto Networks provided the customer names for the interviews but did not participate in the interviews.

Forrester fielded the double-blind survey using a third-party survey partner.

DRIVERS LEADING TO THE PALO ALTO NETWORKS NETWORK SECURITY AND SD-WAN SOLUTION INVESTMENT

Interviewed Organizations

Industry Interviewee Number of employees
Entertainment Deputy CISO 22,000
Retail Network security manager 300,000
Financial services Senior VP 5,500
Retail CISO 11,000
Government Network systems architect 250,000 residents
Healthcare IT security specialist 3,000
Technology manufacturer Manager of IT architecture 65,000
Automative VP of tech ops 26,000
Retail/manufacturing Lead network architect 50,000

Key Challenges

Forrester interviewed nine customers and surveyed 133 customers with experience using Palo Alto Networks network security and SD-WAN. For more details on their organizations, see AppendixB.

The organizations struggled with common challenges, including:

  • Underperforming legacy point cybersecurity solutions.

    Interviewees said their organizations were utilizing legacy point solutions that failed to meet expectations around speed, performance, customer support from the vendor, and a lack of alignment with Zero Trust strategies. Previously deployed products were slow to upgrade, and they cost significant capital investments to maintain necessary hardware and significant operational investments to keep the solutions running.

  • Segmented, decentralized security features and platforms.

    Several interviewees said that before their organizations deployed various Palo Alto Networks NGFW and Cloud-Delivered Security Services to cover on-premises and cloud infrastructures, they were using disparate security solutions that required multiple skill sets to perform simple tasks. Security teams struggled with visibility across multiple technologies, they could not transfer intelligence fast enough, and they lacked a cohesive suite to monitor their networks.

  • Protecting against increasingly sophisticated attacks and a desire for Layer 7 visibility and control.

    As cybersecurity threats become more advanced, interviewees said their organizations were seeking to upgrade their aging security infrastructures and to move away from on-premises point solutions. They sought more granular Layer 7 visibility into their networks and required application-level insight. Their legacy solutions could not provide the visibility or performance needed.

    A network systems architect in government said: “When we deployed our first Palo Alto Networks NGFW, it was very clear it was the only product that had a solid ground-up Layer 7 approach. Every other product was a Layer 3 or Layer 4 firewall with advanced security grafted on as an afterthought. The other very attractive thing that sold us on Palo Alto Networks was the interface. Other manufacturers had neglected the UI and/or had very weak on-box reporting. The visibility we gained by dropping in the first Palo Alto Networks NGFW was better than our purpose-built reporting software that we had struggled to maintain.”

  • Rising costs of MPLS.

    While the security of legacy MPLS WANs were generally meeting expectations, several interviewees said their organizations struggled to justify its rising costs while delivering slower speeds than the public internet. Public internet bandwidth presented a much cheaper option, and the organizations were eager to save millions by abandoning MPLS for a modern SD-WAN solution.

“We realized about four years ago that we didn’t need individual security solutions. We needed a security platform. We actually started talking with our previous vendor about it because it was doing a whole bunch of acquisition. But, frankly, it just wasn’t delivering.”

VP of cybersecurity, entertainment industry


Why Palo Alto Networks?

The organizations searched for a solution that could:

  • Unify security policy and management across network and cloud under the same centralized platform.

    A head of IT architecture in the technology manufacturing industry said: “I now have more consistent security policy across my entire infrastructure worldwide. I don’t have different vendors with different policies and different updates. I’ve got a lot more consistency. It goes back to the singe pane of glass, but even without that, I’ve got a security policy that I know if I can define it once, I can run it everywhere.”

  • Provide threat intelligence.

    The combination of Cloud-Delivered Security Services from Palo Alto Networks automates the analysis of threats and delivery of updates. With network effect, Palo Alto Networks uses a threat discovered with one customer to prevent similar threats for all subscribed customers in seconds or less.

    A network security manager in the retail industry has taken advantage of Unit 42, a large threat research group that operates behind the scenes to improve speed and efficacy of all solutions. They said: “Palo Alto Networks is at the top of the list when you look at comparisons between competitors. Palo Alto Networks is a thought leader in the space, which gives us confidence that we are leveraging the best technology the best way.”

  • Integrate well with existing platforms to enable automation.

    A head of IT architecture in the computer manufacturing industry said: “We wanted out-of-box automation hooks. We didn’t want to have to buy all of the products and then spend another million or so dollars developing automation on top of it. We wanted good integration with the existing platforms that we already have, and we needed to be able to expand into other areas that we haven’t necessarily invested in yet.”

  • Provide a single pane of glass and improved visibility during cloud transformation.

    A CISO in the retail industry said they see the benefits of having an integrated and connected solution. They said “The beauty about this technology is that it all integrates with Panorama. In Panorama, we can control everything from one console. Instead of having 600 firewalls individually managed, I can start looking at my threat traffic through one console. That speaks for itself.”

“The features are a big deal, but I’m looking just from a purely dollars-and-cents point of view. We were able to increase our bandwidth, disband MPLS, and put $3 million in the bank every year just by switching to Prisma SD-WAN. That’s a pretty big winner.”

VP of tech operations, auto industry


Composite Organization

Based on the interviews and survey, Forrester constructed a TEI framework, a composite company, and an ROI analysis that illustrates the areas financially affected. The composite organization is representative of the nine companies that Forrester interviewed and the 133 companies that Forrester surveyed and is used to present the aggregate financial analysis in the next section. The composite organization has the following characteristics:

  • Description of composite.

    The composite organization is a distributed enterprise with 50,000 employees and $7 billion in annual revenue. It has 400 sites including its headquarters, data center, cloud, branch office, and retail and manufacturing locations. The composite’s security team responds to 1,200 incidents a week, or 62,400 in the first year, with each incident taking an average of 2 hours to resolve.

  • Deployment characteristics.

    The organization deploys both physical and virtual firewalls to cover north-south and east-west traffic in its data centers and clouds. It uses the cloud-delivered Prisma Access service to protect branches and remote workers, and to provide cloud access. Palo Alto Networks Cloud-Delivered Security Services supplement each NGFW deployment (physical, virtual, cloud-delivered) with 24/7 monitoring of all vulnerabilities (Threat Prevention), all web-borne threats (URL Filtering, DNS Security, and Prisma SaaS), and all file-based threats (WildFire), providing protection against zero-day threats for all threat vectors with inline machine learning (ML) and updates delivered in seconds or less. The organization deploys IoT Security to monitor and secure expanding device risk from IoT. Additionally, it deploys Prisma SD-WAN to 350 remote sites over three years with 50 sites converted in Year 1 and 150 sites converted each year during the subsequent two years.

Key assumptions:
  • $7B annual revenue
  • 50K employees
  • 400 sites
  • 4 data centers
NEXT SECTION: Analysis Of Benefits

QUANTIFIED BENEFIT AND COST DATA AS APPLIED TO THE COMPOSITE

Total Benefits

Ref Beneit Year 1 Year 2 Year 3 Total Present Value
Atr Security and IT operations efficiency $1,480,216 $2,173,225 $2,628,078 $6,281,520 $5,116,219
Btr End-user productivity improvement $254,530 $366,665 $440,304 $1,061,499 $865,226
Ctr Data breach risk reduction $3,263,008 $3,729,152 $4,195,296 $11,187,456 $9,200,303
Dtr Security infrastructure cost reduction and avoidance $3,969,000 $3,969,000 $3,969,000 $11,907,000 $9,870,316
Etr Security stack management efficiency from common platform $789,750 $739,125 $708,750 $2,237,625 $1,861,296
Ftr IoT security costs and risk reduction $567,340 $567,340 $567,340 $1,702,020 $1,410,891
Gtr Security posture attainment speed $769,500 $71,820 $71,820 $913,140 $812,860
Htr WAN hardware and connectivity cost reduction $637,500 $2,550,000 $4,462,500 $7,650,000 $6,039,726
Itr SD-WAN management efficiency $947,700 $2,041,200 $3,134,700 $6,123,600 $4,903,634
Total benefits (risk-adjusted) $12,678,544 $16,207,527 $20,177,788 $49,063,860 $40,080,471

Security And IT Operations Efficiency

  • IT and SecOps teams benefited from the Palo Alto Networks deployment through reduced number of investigations, faster MTTR, and fewer security issues impacting devices.

    Palo Alto Network’s unified platform helped IT and SecOps professionals automate previously manual processes, define better rules for alerts, and improve visibility into network traffic.

    • Interviewees said that prior to adopting Palo Alto Networks, their organizations struggled to maintain visibility into their networks. This made investigations more challenging and impaired the ability of the SecOps teams to identify and mitigate false positives and other erroneous alerts. Leveraging so many vendors and point solutions made it more challenging and time-consuming to identify and remediate the incidents that were flagged and actually required attention, causing the organizations to allow some alerts to go days without investigation and to skip others altogether.

    • After deploying Palo Alto Networks NGFWs and Cloud-Delivered Security Services, the interviewees’ organizations had a single source of truth for their security teams. This allowed them to correlate issues and threats faster, benefit from consistent coverage across network and cloud infrastructures, and ultimately prevented more serious incidents. Through these improvements, the organizations were able to avoid developing gaps between existing and new sites, significantly improve visibility, and reduce the number of actionable security incidents. This led to a faster MTTR and fewer device issues. Interviewees also noted that deploying Palo Alto Networks increased their organizational security maturity and enabled continuous improvements to their incident detection capabilities over time.

    • A CISO in the retail industry explained how their organization leverages Palo Alto Networks NGFW capabilities to clean up its environment and reduce the number of critical alerts. They said: “Because we put aggressive segmentation in place using data center firewalls, and through continuous monitoring and continuously focusing on attacking any vulnerabilities, my team was able to reduce critical alerts by 80% in that part of our data center. We then moved to a different segment of the data center and repeated the process, ultimately cleaning up our entire environment."

    • Fewer incidents and better maintenance of the security stack reduced the number of end point devices that required reimaging or other manual services from the IT operations team.

    Modeling and assumptions.
  • For the composite organization, Forrester assumes the following:

    • With the previous solution, 1,200 security incidents per week required multi-touch, advanced investigation work from the SecOps team, increasing by 5% annually.

    • There’s an initial reduction in the number of incidents requiring action by 12% in Year 1, and this increases to 27% and 35% in Years 2 and 3 by shifting left enabled by Palo Alto Networks solutions on the core network and cloud perspectives.

    • Prior to using Palo Alto Networks, MTTR was 120 minutes. Having a common platform and improved correlations improves this by 20%.

    • The average fully burdened salary for the SecOps team is $121,500 annually or $58 per hour.

    • With the legacy solution, 50 end point devices per week required reimaging or other services from the IT operations (ITOps) team with the legacy solution.

    • The average fully burdened salary for the ITOps team is $81,000 annually or $39 per hour.

    • The composite organization recaptures 80% of the efficiency gains outlined.

    Risks.
  • Risks that could impact the realization of this benefit include:

    • The number of security incidents that require manual intervention before implementing Palo Alto Networks.

    • The overall impact to MTTR.

    • The number of devices requiring service and labor associated with servicing those devices.

To account for these risks, Forrester adjusted this benefit downward by 15%, yielding a three-year, risk-adjusted total PV (discounted at 10%) of $5.1 million.

“Time-to-resolution on incidents definitely decreased because, with our previous solution, we would have to spend a lot of time figuring out what the problem was, where it was occurring, and what was needed to actually fix the issue. With Palo Alto Networks, we can see what the issue is and where it is occurring immediately, so the analyst can just go there and fix it.”

Senior VP of IT, financial services industry

Security Ops And IT Operations Efficiency

Ref. Metric Calculation Year 1 Year 2 Year 3
A1 Number of security incidents requiring manual investigation/remediation with legacy security solution 1,200 per week 62,400 65,520 68,796
A2 Reduction in security incidents requiring manual investigation/remediation with Palo Alto Networks Composite 12% 27% 35%
A3 Manual multitouch security incidents avoided (showing rounded value) A1*A2 7,488 17,690 24,079
A4 MTTR with prior solution (minutes) Composite 120 120 120
A5 Subtotal: Avoided investigations with Palo Alto Networks A3*A4/60*A8 $868,608 $2,052,040 $2,793,164
A6 MTTR improvement with Palo Alto Networks Composite 20% 20% 20%
A7 Minutes saved per incident A4*A6 24 24 24
A8 Average fully burdened hourly salary: SecOps (showing rounded value) $90K*1.35 (benefits load)/2,080 hours per year $58 $58 $58
A9 Subtotal: SecOps efficiency related to critical alerts (showing rounded value) ((A1-A3)*A7/60)*A8 $1,273,958 $1,109,656 $1,037,434
A10 Number of end point devices requiring reimaging or other services (annually) 50 per week * 52 weeks 2,600 2,600 2,600
A11 Time spent per device with legacy solution (minutes) Composite 45 45 45
A12 Reduction in number of end point devices requiring reimaging with Palo Alto Networks Composite 45% 45% 45%
A13 Average fully burdened hourly salary: IT operations (showing rounded value) 60K*1.35 (benefits load) /2,080 hours per year $39 $39 $39
A14 Subtotal: Reduced IT effort for reimaging (showing rounded value) ((A10*A11)/60)*A12*A13 $34,223 $34,223 $34,223
A15 Productivity capture of security FTE (Composite 80% 80% 80%
At Security and IT operations efficiency (showing rounded value) (A5+A9+A14)*A15 $1,741,431 $2,556,735 $3,091,857
Risk adjustment ↓15%
Atr Security and IT operations efficiency (risk-adjusted) (showing rounded value) $1,480,216 $2,173,225 $2,628,078
Three-year total:$6,281,520 Three-year present value:$5,116,219

End-User Productivity Improvement

    End users experience fewer interruptions and less downtime with a more effective and efficient security platform.
  • Security teams have fewer and faster interactions with end users, and they are able to solve problems remotely with Palo Alto Networks.

    • Before deploying Palo Alto Networks, interviewees’ organizations had confusing and time-consuming security requirements for end users, making remote work or mobile access more challenging and leaving potential gaps in security coverage.

    • With Palo Alto Networks, security teams were able to apply universal rules and policies to all devices, reducing the number of and time-to-resolve security incidents, as well as providing a consistent experience for end users.

    • A senior VP of IT in the financial services industry said: “[Employees] expect to see the same exact experience regardless of the machine that they are on, which is only possible by having the same technology across the network. For the security team, having all the technology centralized to the same platform, the same policy-based rules regardless of location provides comfort that we can deliver that unified experience while minimizing frustration for end users and still guaranteeing the security of our network. This was a big problem before, and we have definitely solved it with Palo Alto Networks.”

  • Modeling and assumptions.

    For the composite organization, Forrester assumes that:

    • End users are impacted by 20% of the security-related investigations the SecOps team completes (expressed in Benefit 1).

    • The average fully burdened salary for end users is $87,750 per year or $42 per hour.

    • End users are impacted by 50% of device reimaging requests.

    • Reimaging a device causes an hour of downtime for the end user involved.

    • End users recapture 80% of the time saved. The other 20% is spent on nonproductive tasks.

    Risks.
  • Risks that could impact the realization of this benefit include:

    • The percentage of security incidents and device reimaging requests that impact end users.

    • The amount of downtime experienced due to investigations and device reimaging.

    • The average fully burdened salary for end users.

To account for these risks, Forrester adjusted this benefit downward by 5%, yielding a three-year, risk-adjusted total PV of $865K.

“We are doing a lot more projects since moving to Palo Alto Networks. We have several big projects we are doing this year that we simply did not have the resources to complete in the past. With Palo Alto Networks, we’re spending a lot more time on projects and a lot less time on day-to-day care and feeding.”

Lead network architect, retail/manufacturing industry

End-User Productivity Improvement

Ref. Metric Calculation Year 1 Year 2 Year 3
B1 Number of multitouch investigations avoided with Palo Alto Networks A3 7,488 17,690 24,079
B2 Number of avoided investigations that would materially impact business end-user productivity (showing rounded value) B1*20% of users 1,498 3,538 4,816
B3 Subtotal: Avoided investigation impact to end users B2*A4/60 minutes per hour*B6 $125,832 $297,192 $404,544
B4 Number of incidents impacting end users still impacted by incidents (showing rounded value) A1-B1*20% of users 10,982 9,566 8,943
B5 Efficiency capture for end users: Reduced time for remediation activities with Palo Alto Networks (hours) (showing rounded value) B4*A7/60 minutes per hour 4,393 3,826 3,577
B6 Average hourly salary: Business user (showing rounded value) $65K*1.35 (benefit load) /2,080 hours per year $42 $42 $42
B7 Subtotal: Efficiency gains for end users from faster MTTR B5*B6 $184,506 $160,692 $150,234
B8 Reduced number of reimages A10*A12 1,170 1,170 1,170
B9 Reimages that are waited on by users (rather than a reissue of loaner asset) Composite 50% 50% 50%
B10 Downtime per reimage (hours) Composite 1.0 1.0 1.0
B11 Subtotal: Avoided device reimages for end users B8*B9*B10*B6 $24,570 $24,570 $24,570
B12 Productivity capture on business users Composite 80% 80% 80%
Bt End-user productivity improvement (B3+B7+B11)*B12 $267,926 $385,963 $463,478
Risk adjustment ↓5%
Btr End-user productivity improvement (risk-adjusted) $254,530 $366,665 $440,304
Three-year total:$1,061,499 Three-year present value:$865,226

Data Breach Risk Reduction

    The organizations were able to improve overall security posture, reducing attack surfaces and moving to a Zero Trust model for their network security.
  • With a centralized and unified solution, organizations can implement the Zero Trust model that Palo Alto Networks technology supports.

    • Interviewees said their organizations previously relied on point solutions that did not necessarily complement or communicate with one another. This left potential gaps in coverage, especially between on-premises and cloud, and created a security architecture that was challenging and labor-intensive to support and manage.

    • With Palo Alto Networks, organizations have a unified solution they can manage from a central location, allowing security teams to easily identify and close any gaps. The fidelity of the information being shared between the security systems is key in effective automated prevention of breaches and pivotal to administrators to being able to apply the proper policies across the numerous devices on and off the corporate network and in the cloud. Palo Alto Networks Cloud-Delivered Security Services further enhance network security by providing 24/7 coverage and support, including automated updates to all NGFWs to protect against the latest threats.

    • Palo Alto Networks brings cloud architecture, remote locations, and SaaS applications into the security posture of the corporate network, specifically with Prisma Access and Prisma SaaS. There are no longer disparate policies, systems, controls, and protection gaps that often expose sites as the initial infection point or root cause of a breach before traversing east-west to reach objectives.

    • A VP of cybersecurity in the entertainment industry said: “We had the best of breed IDS point solution. We had the best of breed web proxy point solution. But we had so many different solutions that nobody received adequate training, so our teams were just doing the minimum necessary keep the system running, close the ticket, and move on. Our best-of-breed antimalware point solution was only catching 40 attempted malwares per month. That’s not good. That’s not a realistic number. So, you can have the best thing in the world, but if you don’t use it and keep it tuned and polished and working, then it’s worthless to you.”

    Modeling and assumptions.
  • For the composite organization, Forrester assumes that:

    • According to Forrester data, the composite organization can expect to experience an average of 3.2 breaches per year relying on point solutions.2

    • Forrester models the cost of a breach by employee count at organizations. For the composite, this is $53 per employee, not counting loss of worker productivity. The costs include the following:

      • Fines to regulatory bodies

      • Customer reimbursement/lawsuits

      • Incident response and remediation

      • Lost revenues

      • Brand equity rebuild costs
      • Cost of customer reacquisition

    • With Palo Alto Networks, organizations can expect to reduce the likelihood of a data breach by up to 45% after three years through an integrated platform by Palo Alto Networks Cloud-Delivered Security Services.

    • Organizations can expect each a breach to impact 20% of all employees with an average of 3.6 hours lost per employee per breach. This is an additional cost in addition to the points above.

    Risks.
  • Risks that could impact the realization of this benefit include:

    • The impact that Palo Alto Networks has on the organization’s overall security posture compared to its previous solution.

    • The percentage of employees impacted by a breach and the duration of downtime associated.

    • The average salary for business users.

To account for these risks, Forrester adjusted this benefit downward by 30%, yielding a three-year, risk-adjusted total PV of $9.2 million.

Data Breach Risk Reduction

Ref. Metric Calculation Year 1 Year 2 Year 3
C1 Average number of data breaches per year Forrester research 3.2 3.2 3.2
C2 Average potential cost of data breach ($53 per employee) exclusive of internal user downtime Forrester research $2,650,000 $2,650,000 $2,650,000
C3 Reduced likelihood of a breach Composite 35% 40% 45%
C4 Avoided costs of remediation, customer resolution, fines brand rebuild, and all other external facing costs C1*C2*C3 $2,968,000 $3,392,000 $3,816,000
C5 Number of internal employees Composite 50,000 50,000 50,000
C6 Average hourly salary: Business user B6 $42 $42 $42
C7 Diminished/eliminated internal user productivity per breach (hours) Forrester research 3.6 3.6 3.6
C8 Average percentage of employees affected per breach Composite 20% 20% 20%
C9 Cost of reduced internal productivity C1*C2*C3 $1,693,440 $1,935,360 $2,177,280
Ct Data breach risk reduction C4+C9 $4,661,440 $5,327,360 $5,993,280
Risk adjustment ↓30%
Ctr Data breach risk reduction (risk-adjusted) $3,263,008 $3,729,152 $4,195,296
Three-year total: $11,187,456 Three-year present value: $9,200,303

Security Infrastructure Cost Reduction And Avoidance

  • Organizations can retire a significant portion of their legacy security infrastructures and services after deploying Palo Alto Networks.

    Networks NGFWs, Cloud-Delivered Security Services, Prisma SD-WAN, and IoT Security, interviewees’ organizations were able to cover their entire networks from data center to edge devices, and they have 24/7 monitoring, support, and updates from the same vendor.

    • Prior to investing in Palo Alto Networks, interviewees’ organizations had a mix of on-premises and cloud solutions as well as some managed services like VPN and sandboxing. They typically onboarded solutions over time as networking strategies shifted from primarily on-premises to a hybrid approach with organizations needing to securely access, manipulate, and share data between on-premises systems, cloud applications and servers, and remote locations like stores, manufacturing sites and distribution centers. As networks grew in complexity, security teams were forced to implement point solutions to cover each new expansion of the network, often resulting in coverage gaps, confusing policies and reducing visibility.

    • With Palo Alto Networks, all security infrastructures and services integrate and communicate seamlessly with Panorama, providing a centralized location and consistent look-and-feel for security professionals to monitor everything that is happening on the network and in the cloud.

    • Interviewees said their organizations found that once they implemented Palo Alto Networks infrastructure and Cloud-Delivered Security Services, many of their legacy infrastructure and services became redundant and were outperformed by the unified Palo Alto Networks solution. The organizations typically replaced legacy firewalls with NGFWs at their end of life, so they were able to avoid the capital expenditure of repurchasing hardware. Palo Alto Networks Cloud-Delivered Security Services subscriptions supplanted most of the legacy services that interviewees relied on, allowing them to end their contracts and reduce the number of vendors and disparate systems in their environments.

  • Modeling and assumptions.

    For the composite organization, Forrester assumes that:

    • Point solutions are implemented over time to ensure and expand security coverage as network architecture and cloud strategy evolve.

    • Legacy firewall savings are associated with management and maintenance (e.g., operational expenses) as hardware costs are relatively similar.

    • Palo Alto Networks NGFWs and Cloud-Delivered Security Services subscriptions combine to replace the technologies listed. However, there is not necessarily a 1:1 replacement.

    • Most technologies come from different vendors, so each replaced technology represents one fewer vendor in the composite organization’s environment.

  • Risks.

    Risks that could impact the realization of this benefit include:

    • The annual cost associated with each technology being replaced.

    • The speed at which an organization can replace these technologies due to license agreements/terms and network configurations.

To account for these risks, Forrester adjusted this benefit downward by 30%, yielding a three-year, risk-adjusted total PV of $9.9 million.

“We have been able to sunset a lot of vendors because of Palo Alto Networks. We got rid of two different firewall vendors, and we removed our proxy and our VPN. We certainly see some capex savings there, but a lot of the real savings are coming from our operational teams. They don’t have to worry about training on and managing five different tools and vendors. Now we’re training and managing in one tool and one policy.”

Senior VP, financial services industry

Security Infrastructure Cost Reduction And Avoidance

Ref. Metric Calculation Year 1 Year 2 Year 3
D1 IPS/IDS Composite $200,000 $200,000 $200,000
D2 Legacy firewalls 80% of hardware*20% $240,000 $240,000 $240,000
D3 Web proxy Composite $250,000 $250,000 $250,000
D4 VPN vendor/service Composite $360,000 $360,000 $360,000
D5 URL filtering Composite $250,000 $250,000 $250,000
D6 Sandboxing Composite $500,000 $500,000 $500,000
D7 DNS Composite $450,000 $450,000 $450,000
D8 Cloud-based protection Composite $720,000 $720,000 $720,000
D9 SaaS CASB Composite $2,700,000 $2,700,000 $2,700,000
Dt Security infrastructure cost reduction and avoidance D1+D2+D3+D4+D5+ D6+D7+D8+D9 $5,670,000 $5,670,000 $5,670,000
Risk adjustment ↓30%
Dtr Security infrastructure cost reduction and avoidance (risk-adjusted) $3,969,000 $3,969,000 $3,969,000
Three-year total: $11,907,000 Three-year present value: $9,870,316

Security Stack Management Efficiency From Common Platform

  • Having centralized management and a single pane of glass allows IT teams to reallocate resources away from maintenance activities to higher-value tasks.

    Automated updates and patching, universal policy application, and reduced investigation work free up valuable resources who can now focus on improving capabilities instead of performing mundane maintenance work.

    • Prior to using Palo Alto Networks, the interviewees’ organizations relied on point solutions from different vendors to manage, monitor, and secure their networks. When issues arose or updates became available, it took a team of workers with different skill sets and proficiencies to tackle the issue or manually apply updates and patches to individual devices and programs. Visibility into network activity was poor because many of the point solutions struggled to communicate or integrate with a centralized system.

    • With Palo Alto Networks, interviewees’ organizations were able to reduce the number of vendors in their environments, thus reducing the number of different skill sets required to manage and maintain their systems. Additionally, with a unified platform and a single source of truth in Panorama, the organizations had much better visibility into network traffic and could seamlessly apply updates, patches, and policy rules across the environments with much less effort. The workers who no longer need to focus on maintenance work are now able to help support initiatives and projects that drive value for the organizations.

    • A VP of cybersecurity in the entertainment industry said: “One of the top benefits is the commonality of the platform. Now I don’t need to send people to different trainings to figure out how to use our tools. Everything is in Panorama, so Wildfire, URL Filtering, the firewall policies, and decrypt rules are all in a single place. It all comes back to that common user interface model.”

  • Modeling and assumptions.

    For the composite organization, Forrester assumes that:

    • A team of 15 employees is responsible for managing the legacy solution including handling security policy, zero-day threats, updates and patching of infrastructure, and orchestration and management of cloud data.

    • The organization reallocates 2.5 FTEs due to Wildfire, eliminating advanced threat investigation work and shifting left the security workflow.

    • Updates and patches can be applied across the network from a central location, reallocating one employee to focus on higher-value tasks.

    • Similarly, the organization can now manage security policy and cloud data through a centralized console for both cloud and on-premises. Cloud-Delivered Security Services like Prisma SaaS reduce the workload related to policy formation and policy management.

    • The average, fully burdened salary for these workers is $112,500 per year.

  • Risks.

    Risks that could impact the realization of this benefit include:

    • The size and skill set of an organization’s security management team.

    • The capabilities and systems that are in place before deploying Palo Alto Networks.

    • The average salary of the network, security, and IT operations teams.

To account for these risks, Forrester adjusted this benefit downward by 10%, yielding a three-year, risk-adjusted total PV of $1.9 million.

Security Stack Management Efficiency From Common Platform

Ref. Metric Calculation Year 1 Year 2 Year 3
E1 Team responsible for platform management Composite 15 15 15
E2 Shift left to eliminate advanced investigational work (shown as FTE savings) Interviews 2.5 2.5 2.5
E3 Reduced effort updates/patching of security hardware stack (FTEs) Interviews 1 1 1
E4 Reduced effort: Policy management through single platform for cloud and on-premises (FTEs) Interviews 4.3 3.8 3.5
E5 Average annual salary: IT employee (NetOps, SecOps, IT operations) $112,500 $112,500 $112,500
Et Security stack management efficiency from common platform (E2+E3+E4)*E5 $877,500 $821,250 $787,500
Risk adjustment ↓10%
Etr Security stack management efficiency from common platform (risk-adjusted) $789,750 $739,125 $708,750
Three-year total: $2,237,625 Three-year present value: $1,861,296

IoT Security Costs And Risk Reduction

  • Palo Alto Networks IoT Security gives organizations a centralized management platform for all connected devices, reducing management effort and improving device health and lifecycle.

    IoT management teams can perform health checks and locate devices from a centralized platform, reducing manual search times, streamlining patches and updates, and extending the useful life of some devices.

    • Prior to deploying Palo Alto Networks IoT Security, interviewees’ organizations did not have a centralized IoT solution to monitor and secure their IoT infrastructures. There had security policies in place, but the legacy systems did not provide device-level visibility and left the IoT teams in the dark about potential threats moving laterally in their environments. Additionally, the interviewees’ said their organizations found that employees would frequently lose or hide devices. And when a device needed maintenance, there was no easy way to locate it or learn about the issue.

    • With IoT Security from Palo Alto Networks, all IoT devices are connected through a centralized management dashboard that gives a real-time risk score and easy-to-read reports about the number of vulnerabilities and the level of criticality. This significantly reduces the time and effort needed to secure the network. Additionally, because devices are easier to manage and physically locate, interviewees’ organizations were able to reduce the number of new and replacement devices they purchase each year.

      An IT security specialist in the healthcare industry said: “As soon as I pull up my IoT Security dashboard each morning, I can see the risk score and look at all my vulnerabilities to date. If the score is medium or high, I can see all of those alerts, what device they are coming from, and exactly what happened so my team can address the issues and bring the score back down.”

  • Modeling and assumptions.

    For the composite organization, Forrester assumes that:

    • A team of six employees manages the IoT deployment, including security and physical device management.

    • With IoT Security, this team is able to reduce the total time spent on device management by 20%, focusing its efforts on security and keeping devices healthy.

    • The organization budgets $5 million per year for device purchases and replacements, saving 10% of this budget with consistent monitoring.

  • Risks.

    Risks that could impact the realization of this benefit include:

    • The size and maturity of the IoT management team and the previous IoT management solution.

    • The annual budget for IoT devices and the impact that better device management and the ability to locate devices more accurately has on extending device lifecycles.

To account for these risks, Forrester adjusted this benefit downward by 5%, yielding a three-year, risk-adjusted total PV of $1.4 million.

“IoT Security gives peace of mind to our board members. They read something in the news about an IoT attack or vulnerability, and I can confidently tell them that that we have it covered. We have a 24-hour IoT SIEM [security information and event management]. That peace of mind goes a long way, and it is worth the money itself.”

IT security specialist, healthcare industry

IoT Security Costs And Risk Reductions

Ref. Metric Calculation Year 1 Year 2 Year 3
F1 IoT management team Composite 6 6 6
F2 Reduction in management effort with IoT Security Composite 20% 20% 20%
F3 Average annual salary: IT operations employee $60K*1.35 (benefit load) $81,000 $81,000 $81,000
F4 Subtotal: Reduced management effort F1*F2*F3 $97,200 $97,200 $97,200
F5 IoT devices (annual budget) Composite $5,000,000 $5,000,000 $5,000,000
F6 Reduced number of new devices purchased Composite 10% 10% 10%
F7 Subtotal: Reduced IoT device spend F5*F6 $500,000 $500,000 $500,000
Ft IoT security costs and risk reduction F4+F7 $597,200 $597,200 $597,200
Risk adjustment ↓5%
Ftr IoT security costs and risk reduction (risk-adjusted) $567,340 $567,340 $567,340
Three-year total: $1,702,020 Three-year present value: $1,410,891

Security Posture Attainment Speed

  • Palo Alto Networks’ consistent technology, unified platform, and advanced management capabilities allow organizations to get to steady state faster.

    Organizations can stand up their security stack faster, reduce implementation effort, and allow security teams to start fine-tuning sooner than if they leveraged point solutions.

    • With any security solution, it is important to be able to quickly adapt to new and evolving threats and to implement rules and policies across the network. Interviewees said their organizations were spending so much time and resources to keep the lights on that it was difficult to allocate enough resources to make the kinds of improvements decision-makers deemed necessary to protect against ever-advancing threats.

    • With Palo Alto Networks, all components integrate to a common platform and have a similar look and feel. This makes deployments faster and frees up resources to fine-tune the solution, to implement automated workflows, and to find ways to improve efficiency for security, IT, and business users.

      A networks systems architect in government said: “As the environment changed this spring and we had our students go remote, we initially just had a Band-Aid solution. Once we went with Palo Alto Networks, we were protecting every student, regardless of their location, by the fall.”

  • Modeling and assumptions.

    For the composite organization, Forrester assumes that:

    • The organization uses the same deployment team in both scenarios. This includes 20 SecOps employees and 12 NetOps employees in the initial year of the deployment.

    • The average fully burdened salary of a SecOps employee is $121,000 per year and the average fully burdened salary of a NetOps employee is $135,000 per year.

    • With point solutions, this team takes 8.1 months to reach steady state. With Palo Alto Networks, the same team reaches steady state in 5.7 months.

  • Risks.

    Risks that could impact the realization of this benefit include:

    • The size of the deployment team and relative salaries.

    • The specific components being deployed and time it takes to reach steady state

To account for these risks, Forrester adjusted this benefit downward by 5%, yielding a three-year, risk-adjusted total PV of $813K.

“If we didn’t use Palo Alto Networks, we would have probably measured the time it took to get here in years.”

IT security specialist, healthcare industry

Security Posture Attainment Speed

Ref. Metric Calculation Year 1 Year 2 Year 3
G1 SecOps FTE annual salary with benefits $90K*1.35 $121,500 $121,500 $121,500
G2 NetOps FTE annual salary with benefits $100K*1.35 $135,000 $135,000 $135,000
G3 SecOps FTEs Composite 20 2 2
G4 NetOps FTEs Composite 12 1 1
G5 Time required to achieve proper security posture with point solutions (months) Survey 8.1 8.1 8.1
G6 Time required to achieve proper security posture with Palo Alto Networks (months) Survey 5.7 5.7 5.7
G7 Time difference between point solutions and Palo Alto Networks (initial and ongoing) (rounded) 1-(G6/G5) 30% 30% 30%
G8 Cost to steady state point solutions (G1*G3/12*G5)+(G2*G4/12*G5) $2,733,750 $255,150 $255,150
G9 Time difference between point solutions and Palo Alto Networks (initial and ongoing) (G1*G3/12*G6)+(G2*G4/12*G6) $1,923,750 $179,550 $179,550
Gt Security posture attainment speed G8-G9 $810,000 $75,600 $75,600
Risk adjustment ↓5%
Gtr Security posture attainment speed (risk-adjusted) $769,500 $71,820 $71,820
Three-year total: $913,140 Three-year present value: $812,860

WAN Hardware And Connectivity Cost Reduction

  • For SD-WAN deployments, organizations save money on both hardware and WAN connectivity costs by leveraging Prisma SD-WAN and public internet for WAN connectivity.

    Buying Prisma SD-WAN appliances is slightly cheaper than the cost of replacing legacy routers used for MPLS and public internet, and it’s significantly cheaper (more than 90% cheaper for the interviewees' organizations) and faster than traditional MPLS connections.

    • Prior to using Prisma SD-WAN, the interviewees’ organizations relied on MPLS connections to connect remote sites to the central networks and data centers. These MPLS connections leveraged expensive connections like T1 circuits to connect and exchange data. While these connections are secure, interviewees said growing bandwidth demands were outpacing MPLS capabilities and the architecture did not allow for sufficient visibility into network traffic.

    • With Prisma SD-WAN, the interviewees’ organizations were able reduce operating expenses by leveraging cheaper and faster public internet at all of their sites, replacing the slower and significantly more expensive MPLS connections. Additionally, Prisma SD-WAN appliances are slightly cheaper than the legacy solution hardware, saving additional capital costs. Interviewees reported that this solution also provided greater visibility into their network traffic and supported the Zero Trust architectures of the core networks.

    • A lead network architect in the retail/manufacturing industry said: “We are saving millions — not tens or hundreds of thousands. No, we’re saving millions over the course of three years just on transport costs.”

    • When asked how to justify the Prisma SD-WAN investment to the executive team, a VP of technology operations in the auto industry said: “I usually start with, ‘It will save $3 million a year, and, oh, by the way, in saving that, we are going to have less administrative overhead and a more resilient network, and we can troubleshoot faster and easier.’”

  • Modeling and assumptions.

    For the composite organization, Forrester assumes that:

    • 50 stores are converted from MPLS to Prisma SD-WAN in the first year as the team continuously tests the connections and updates policies. After the first year, the same team deploys to an additional 150 stores in each subsequent year as the legacy hardware reaches end of life.

    • By switching to public internet, the organization saves $14,000 per year per store on WAN connectivity, reducing costs by over 90%.

    • MPLS hardware cost $1,000 per site.

  • Risks.

    Risks that could impact the realization of this benefit include:

    • The cost of MPLS hardware.

    • The cost of public internet.

    • The number of stores or sites converting to SD-WAN.

To account for these risks, Forrester adjusted this benefit downward by 15%, yielding a three-year, risk-adjusted total PV of $6.04 million.

“This thing prints money.”

Senior manager of network services, automotive industry

WAN Hardware And Connectivity Cost Reduction

Ref. Metric Calculation Year 1 Year 2 Year 3
H1 Number of sites Composite 50 200 350
H2 MPLS hardware Composite $1,000 $1,000 $1,000
H3 Cost savings: WAN connectivity (per site, per year) Composite $14,000 $14,000 $14,000
Ht WAN hardware and connectivity cost reduction (H3+H2)*H1 $750,000 $3,000,000 $5,250,000
Risk adjustment ↓15%
Htr WAN hardware and connectivity cost reduction (risk-adjusted) $637,500 $2,550,000 $4,462,500
Three-year total: $7,650,000 Three-year present value: $6,039,726

SD-WAN Management Efficiency

  • With Prisma SD-WAN, operations teams are able to apply consistent policies across the deployment from a centralized location.

    Additionally, branch office and in-store retail workers can leverage new applications with improved bandwidth and enhanced security at each site.

    • Prior to deploying Prisma, the interviewees’ organizations had to manage their MPLS hardware manually, forcing them to send resources on-site or to rely on more expensive third parties to help maintain their networks. Additionally, branch office and in-store employees were unable to leverage advanced application and tools because the MPLS networks could not support the necessary bandwidth.

    • With Prisma SD-WAN, organizations are able to manage their entire deployment from a central console, applying patches and updates with zero downtime or impact to the business. In-store workers benefit from more bandwidth, and they now have the ability to leverage cloud-based applications to better serve customers.

    • A director of cybersecurity in the automotive industry stated: “One of the big benefits that we have seen is the fact that we can get rid of the MPLS network, which is kind of a black hole from a security perspective within our infrastructure. We can’t really see what’s traversing that network. We don’t have any good controls on the data center side or the store side to be able to put any kind of telemetry on that network, so we don’t really know what’s traversing it. With Prisma SD-WAN, we have full visibility into network traffic and now the ability to investigate what that traffic is actually doing in our environment and where it’s coming from.”

    • A lead network architect in the retail industry said; “Being able to manage them all centrally is huge. You start the upgrade and 10 minutes later, you’re done.”

  • Modeling and assumptions.

    For the composite organization, Forrester assumes that:

    • A team of four IT operations employees managed the MPLS network. The organization reallocated two of these FTEs to higher-value tasks due to the centralized management capabilities of Prisma SD-WAN.

    • Branch and in-store retail workers are able to save almost an hour per day with a faster network and better tools to serve customers.

  • Risks.

    Risks that could impact the realization of this benefit include:

    • The size and configuration of the MPLS deployment.

    • The impact that faster network speeds have on in-store employee productivity.

To account for these risks, Forrester adjusted this benefit downward by 10%, yielding a three-year, risk-adjusted total PV of $4.9 million.

Reduced management effort for remote sites

50%

SD-WAN Management Efficiency

Ref. Metric Calculation Year 1 Year 2 Year 3
I1 FTEs managing MPLS Composite 4 4 4
I2 Reduction in management effort (FTEs) Composite 2 2 2
I3 Average annual salary: IT operations employee $60K * 1.35 $81,000 $81,000 $81,000
I4 Subtotal: Management efficiencies I1*I2*I3 $648,000 $648,000 $648,000
I5 Efficiency gains for in-store workers Composite 12% 12% 12%
I6 Average annual salary: Site manager $50K * 1.35 $67,500 $67,500 $67,500
I7 Subtotal: On-site efficiency H1*I5*I6 $405,000 $1,620,000 $2,835,000
It SD-WAN management efficiency I4+I7 $1,053,000 $2,268,000 $3,483,000
Risk adjustment ↓10%
Itr SD-WAN management efficiency (risk-adjusted) $947,700 $2,041,200 $3,134,700
Three-year total: $6,123,600 Three-year present value: $4,903,634
NEXT SECTION: Analysis Of Costs

Total Costs

Ref. Cost Initial Year 1 Year 2 Year 2 Total Present Value
Jtr Installation and deployment costs $2,018,250 $659,813 $504,563 $504,563 $3,687,188 $3,414,159
Ktr Training and ongoing management $80,784 $30,175 $30,175 $30,175 $171,310 $155,825
Ltr Palo Alto Networks Costs: hardware, licensing, etc. $1,349,303 $2,018,625 $2,156,910 $2,353,785 $7,878,623 $6,735,420
Mtr SD-WAN deployment costs $0 $152,758 $545,484 $870,358 $1,568,600 $1,243,597
Total costs (risk-adjusted) $3,448,337 $2,861,371 $3,237,132 $3,758,881 $13,305,721 $11,549,001

Installation And Deployment Costs

Interviewees noted that while there was some time and effort involved with deploying Palo Alto Network products, the deployment ran smoothly, and they did not experience any significant delays or roadblocks due to Palo Alto Network’s consistent technology and ability to automatically update policies across the network. It should be noted that the alternative point solutions would require a new deployment with every new product purchased, multiplying this effort with every attempt to increase security and reduce risk.

    Modeling and assumptions.

    For the composite organization, Forrester assumes that:

    • For the NGFW and Cloud-Delivered Security Services deployment, 10 network operations employees spend a total of nine months upgrading firewalls and aligning policies in the initial period, and they spend almost five months fine-tuning in Year 1. The organization leverages end-of-life cycles and invests time to test the deployment, extending the timeline, but also ensuring a smooth transition away from its legacy solution.

    • For the IoT Security deployment, a team of eight networks operations employees spends three months connecting and testing all IoT devices. A team of two networks operations employees spends roughly six weeks per year managing and maintaining the IoT deployment.

    • The SD-WAN deployment is rolled out in phases, starting with 50 sites and then with an additional 150 sites in each subsequent year. A team of six networks operations employees manages this rollout and significantly improves the speed at which the organization can upgrade a remote site after the initial 50 sites.

    • The average fully loaded annual salary for a network operations employee is $135,000.

  • Risks.

    Risks that could impact these costs include:

    • The amount of time and effort needed to deploy the NGFWs, IoT Security, and SD-WAN.

    • The average salary for deployment team members.

To account for these risks, Forrester adjusted this cost upward by 15%, yielding a three-year, risk-adjusted total PV (discounted at 10%) of $3.4 million.

Installation And Deployment Costs

Ref. Metric Calculation Initial Year 1 Year 2 Year 3
J1 Network team working on firewall upgrade (FTEs) 10 10
J2 Time spent on upgrade 80% 40%
J3 Annual salary: NetOps employee G2 $135,000 $135,000
J4 Subtotal: Implementation labor for NGFW, software, and subscriptions J1*J2*J3 $1,080,000 $540,000 $0
J5 IoT deployment team (FTEs) 8 2 2 2
J6 Time spent on IoT Security deployment 25.0% 12.5% 12.5% 12.5%
J7 Annual salary: NetOps employee G2 $135,000 $135,000 $135,000 $135,000
J8 Subtotal: Implementation and fine-tuning labor for IoT Security deployment J5*J6*J7 $270,000 $33,750 $33,750 $33,750
J9 SD-WAN deployment team (FTEs) 6 6 6
J10 Time spent on SD-WAN deployment 50% 50% 50%
J11 Annual salary: NetOps employee G2 $135,000 $135,000 $135,000 $135,000
J12 Subtotal: SD-WAN implementation labor J9*J10*J11 $405,000 $0 $405,000 $405,000
Jt Installation and deployment costs J4+J8+J12 $1,755,000 $573,750 $438,750 $438,750
Risk adjustment ↑15%
Jtr Installation and deployment costs (risk-adjusted) $2,018,250 $659,813 $504,563 $504,563
Three-year total: $3,687,188 Three-year present value: $3,414,159

Training And Ongoing Management

Interviewees noted that Palo Alto Networks solutions required significantly less training overall compared to all of their legacy point solutions. Additionally, the training resources that Palo Alto Networks provided were effective and gave employees the tools and knowledge they needed to be successful working across the various products and solutions.

  • Modeling and assumptions.

    For the composite organization, Forrester assumes that:

    • A total of 20 hours of training is required for the NGFW and Cloud-Delivered Security Services training for employees new to Palo Alto Networks. In subsequent years, 8 hours of training is required to share any new features, updates, and enhancements.

    • For IoT Security, 8 hours of training is required to initially familiarize employees with the new platform and capabilities. Two hours of training for new features and updates is required in subsequent years.

    • For SD-WAN, 8 hours of training is required for the initial deployment, with 1 hour required in subsequent years to provide updates on any new features or enhancements.

    • The average fully loaded salary across IT is $54 per hour.

  • Risks.

    Risks that could impact these costs include:

    • The size and experience level of the IT organization with Palo Alto Networks solutions.

    • The average salary of IT employees.

To account for these risks, Forrester adjusted this cost upward by 10%, yielding a three-year, risk-adjusted total PV of $156K.

“Much less training equates to much more consistent and rapid care and feeding of the solution overall. My team is able to keep things current more easily, and that is important because the bad guys are constantly innovating.”

Senior directory of cybersecurity, entertainment industry

Training And Ongoing Maintenance

Ref. Metric Calculation Initial Year 1 Year 2 Year 3
K1 Training for Palo Alto Networks: Prisma Access, NGFW capabilities, subscription services (hours) Composite 20 8 8 8
K2 Training: IoT Security (hours) Composite 8 2 2 2
K3 Training: SD-WAN (hours) Composite 8 1 1 1
K4 FTEs receiving training for Palo Alto Networks Composite 60 60 60 60
K5 FTEs receiving training for IoT Security Composite 8 8 8 8
K6 FTEs receiving training for SD-WAN Composite 12 12 12 12
K7 Average annual salary: IT org employee (SecOps, NetOps, IT operations) E5 $54 $54 $54 $54
Kt Training for ongoing management (K1*K4*K7)+(K2*K5*K7)+(K3*K6*K7) $73,440 $27,432 $27,432 $27,432
Risk adjustment ↑10%
Ktr Training and ongoing management (risk-adjusted) $80,784 $30,175 $30,175 $30,175
Three-year total: $171,310 Three-year present value: $155,825

Palo Alto Networks Costs: Hardware, Licensing, Etc.

Interviewees said they are comfortable with Palo Alto Networks pricing, noting that they intentionally purchased premium hardware and security services.

    • The interviewees’ organizations purchased hardware up front and were able to amortize the three-year subscription services costs over the three-year contract term, providing predictable annual costs.

  • Modeling and assumptions.

    For the composite organization, Forrester assumes that:

    • All hardware is purchased up front while subscription contracts are amortized over the three-year term.

    • The organization deploys a total of 60 NGFWs (including physical and virtual), Panorama, and security services for all NGFWs, along with Prisma Access to protect remote sites and IoT devices and Prisma SaaS to cover all cloud and SaaS applications.

  • Risks.

    Risks that could impact these costs include:

    • The size of the NGFW deployment.

    • The number of Cloud-Delivered Security Services needed.

    • The number of IoT devices and remote sites included in the deployment.

To account for these risks, Forrester adjusted this cost upward by 5%, yielding a three-year, risk-adjusted total PV of $6.7 million.

Palo Alto Networks Costs: Hardware, Licensing, Etc.

Ref. Metric Calculation Initial Year 1 Year 2 Year 3
L1 Hardware costs Composite $1,285,050 $0 $0 $0
L2 Software costs Composite $0 $105,000 $105,000 $105,000
L3 Cloud-delivered security subscriptions and services costs Composite $0 $1,817,500 $1,949,200 $2,136,700
Lt Palo Alto Networks costs L1+L2+L3 $1,285,050 $1,922,500 $2,054,200 $2,241,700
Risk adjustment ↑5%
Ltr Palo Alto Networks costs (risk-adjusted) $1,349,303 $2,018,625 $2,156,910 $2,353,785
Three-year total: $7,878,623 Three-year present value: $6,735,420

SD-WAN Deployment Costs

Interviewees noted that SD-WAN hardware can be configured remotely, making it simple to send hardware to remote sites and to switch from MPLS to SD-WAN overnight with a lean team.

    • SD-WAN upgrades became faster and required fewer labor-hours as the organizations refined the process, and the deployment teams gained experience working with the technology.

    • Negotiating connectivity costs for all sites with the same ISP provided organizations more leverage to secure a consistent price across all locations and further reduce monthly operating costs.

  • Modeling and assumptions.

    For the composite organization, Forrester assumes that:

    • It upgrades 50 sites in Year 1, with 150 sites upgraded in subsequent years. The phased deployment strategy is used first to prove that the new technology works and to leverage end-of-life cycles for aging MPLS infrastructure.

    • In addition to the hardware, the composite organization purchases different bandwidth subscriptions depending on the needs and use case for each remote site.

    • The organization purchases the bandwidth subscriptions at the time of installation and they last 12 months.

  • Risks.

    Risks that could impact these costs include:

    • When the organization elects to purchase hardware (up front or annually).

    • The number of sites and bandwidth requirements for each site.

To account for these risks, Forrester adjusted this cost upward by 15%, yielding a three-year, risk-adjusted total PV of $1.2 million.

SD-WAN Deployment Costs

Ref. Metric Calculation Initial Year 1 Year 2 Year 3
M1 Number of SD-WAN deployments Composite 0 50 150 150
M2 Prisma SD-WAN hardware Composite $0 $24,500 $73,500 $73,500
M3 Prisma subscription costs Composite $0 $108,333 $400,834 $683,333
Mt SD-WAN deployment costs M2+M3 $0 $132,833 $474,334 $756,833
Risk adjustment ↑15%
Mtr SD-WAN deployment costs (risk-adjusted) $0 $152,758 $545,484 $870,358
Three-year total: $1,568,600 Three-year present value: $1,243,597
NEXT SECTION: Financial Summary

CONSOLIDATED THREE-YEAR RISK-ADJUSTED METRICS
  • These risk-adjusted ROI, NPV, and payback period values are determined by applying risk-adjustment factors to the unadjusted results in each Benefit and Cost section.

Cash Flow Chart (Risk-Adjusted)

Cash Flow Table (Risk-Adjusted Estimates)

Initial Year 1 Year 2 Year 3 Total Present Value
Total costs ($3,448,337) ($2,861,371) ($3,237,132) ($3,758,881) ($13,305,720) ($11,549,001)
Total benefits $0 $12,678,544 $16,207,527 $20,177,789 $49,063,859 $40,080,471
Net benefits ($3,448,337) $9,817,173 $12,970,395 $16,418,908 $35,758,140 $28,531,470
ROI 247%
Payback period (months) 6
NEXT SECTION: Glossary: Palo Alto Networks Products
  • Prisma SD-WAN: Application-defined and autonomous next-generation SD-WAN solution that enables a cloud-delivered branch.

  • DNS Security: A cloud-delivered service that applies predictive analytics to disrupt attacks that use DNS for command and control or data theft as they occur. Combines with URL Filtering as a secure web gateway solution.

  • IoT Security: A complete IoT Security product with visibility, risk assessment, prevention, and enforcement for every IoT and OT device.

  • Next-Generation Firewalls (NGFW): Application-defined and autonomous next-generation SD-WAN solution that enables a cloud-delivered branch.

  • Panorama: Centralized network security management solution for Palo Alto Networks Next-Generation Firewalls -- all form factors and all locations.

  • Prisma Access: A secure access service edge (SASE) solution for networking and security in a purpose-built, cloud-delivered infrastructure.

  • Prisma SaaS: Comprehensive visibility, security, and compliance across the industry’s broadest range of SaaS applications and the data within.

  • Threat Prevention: Advanced intrusion prevention system (IPS) that inspects all traffic and automatically blocks known threats and vulnerabilities.

  • URL Filtering: Cloud-delivered web security that protects against web-based threats such as phishing and credential attacks. Combines with DNS Security as a secure web gateway solution.

  • WildFire: Advanced malware analysis engine that identifies and protects against unknown and zero-day file-based threats, then distributes updates to all customers in seconds or less.

NEXT SECTION: Appendix

Appendix A: Total Economic Impact

Total Economic Impact is a methodology developed by Forrester Research that enhances a company’s technology decision-making processes and assists vendors in communicating the value proposition of their products and services to clients. The TEI methodology helps companies demonstrate, justify, and realize the tangible value of IT initiatives to both senior management and other key business stakeholders.

Total Economic Impact Approach

  • Benefits represent the value delivered to the business by the product. The TEI methodology places equal weight on the measure of benefits and the measure of costs, allowing for a full examination of the effect of the technology on the entire organization.

  • Costs consider all expenses necessary to deliver the proposed value, or benefits, of the product. The cost category within TEI captures incremental costs over the existing environment for ongoing costs associated with the solution.

  • Flexibility represents the strategic value that can be obtained for some future additional investment building on top of the initial investment already made. Having the ability to capture that benefit has a PV that can be estimated.

  • Risks measure the uncertainty of benefit and cost estimates given: 1) the likelihood that estimates will meet original projections and 2) the likelihood that estimates will be tracked over time. TEI risk factors are based on “triangular distribution.”

  • PRESENT VALUE (PV)

    The present or current value of (discounted) cost and benefit estimates given at an interest rate (the discount rate). The PV of costs and benefits feed into the total NPV of cash flows.

  • NET PRESENT VALUE (NPV)

    The present or current value of (discounted) future net cash flows given an interest rate (the discount rate). A positive project NPV normally indicates that the investment should be made, unless other projects have higher NPVs.

  • RETURN ON INVESTMENT (ROI)

    A project’s expected return in percentage terms. ROI is calculated by dividing net benefits (benefits less costs) by costs.

  • DISCOUNT RATE

    The interest rate used in cash flow analysis to take into account the time value of money. Organizations typically use discount rates between 8% and 16%.

  • PAYBACK PERIOD

    The breakeven point for an investment. This is the point in time at which net benefits (benefits minus costs) equal initial investment or cost.


Appendix B: Survey Demographics

Appendix C: Endnotes

1Total Economic Impact is a methodology developed by Forrester Research that enhances a company’s technology decision-making processes and assists vendors in communicating the value proposition of their products and services to clients. The TEI methodology helps companies demonstrate, justify, and realize the tangible value of IT initiatives to both senior management and other key business stakeholders.

2Cost Of A Security Breach,” Internal Forrester Survey Data, August 2020.